-
Feature Request
-
Resolution: Unresolved
-
 L3 - Default
-
None
-
None
-
2
-
Not defined
-
3 - Expected
What is the desired functionality that you are missing?
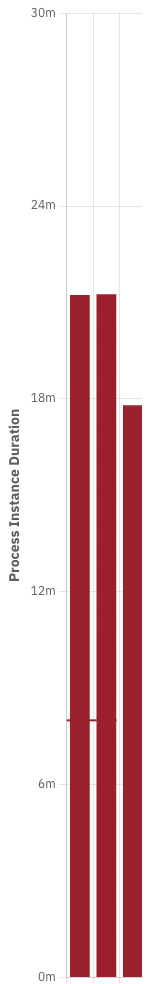
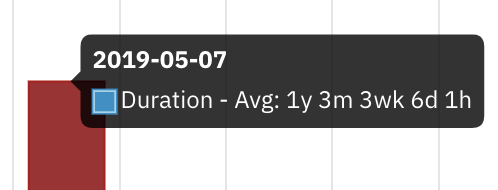
When I view charts showing duration information
I want to view readable time buckets
So that I can understand how time data is distributed
Which problem are you going to solve with this functionality?
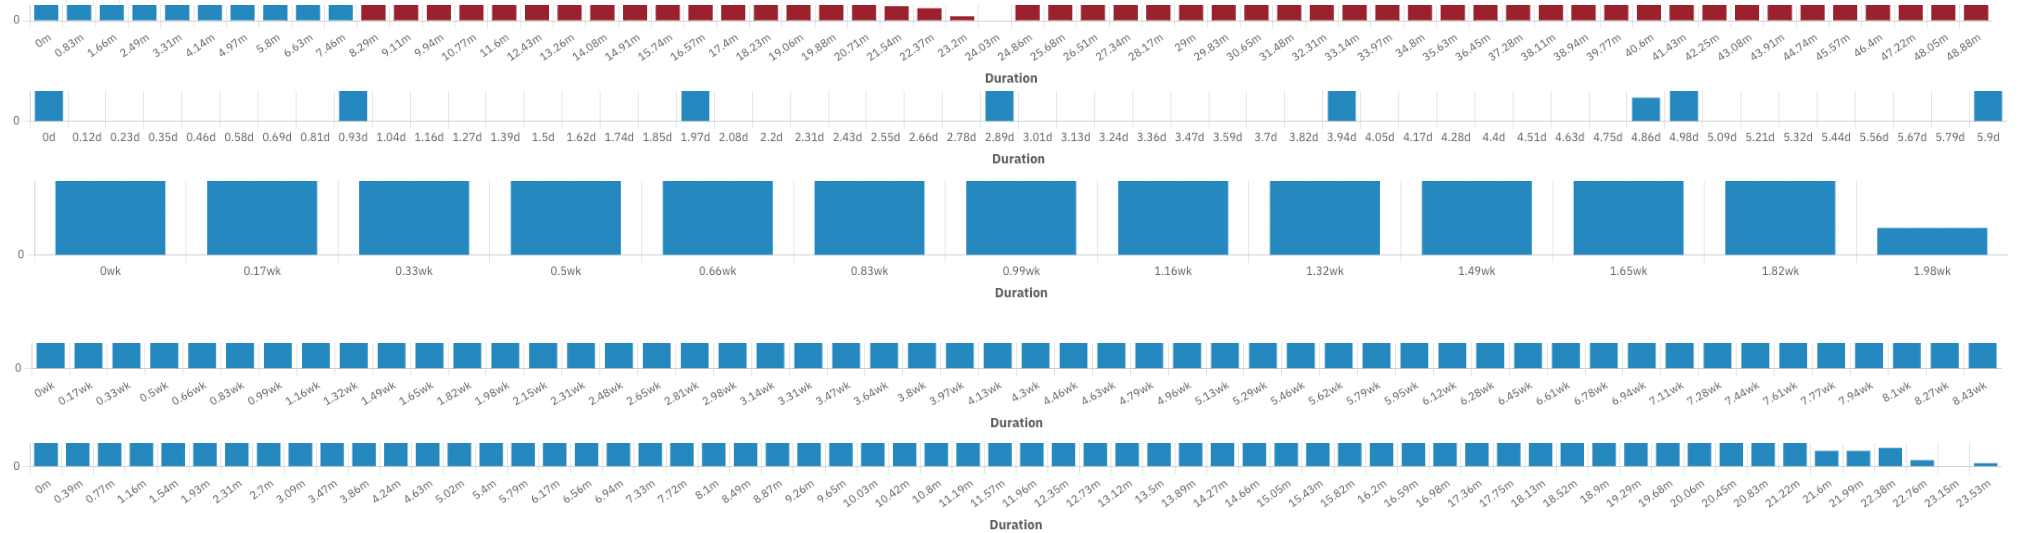
Duration buckets are difficult to understand, according to one piece of user testing feedback.

User Scenario
KEY: MH=Must Have, SH=Should Have, NTH=Nice to Have
(SH) GIVEN I am viewing a report distributed by duration
(SH) OR viewing a duration report
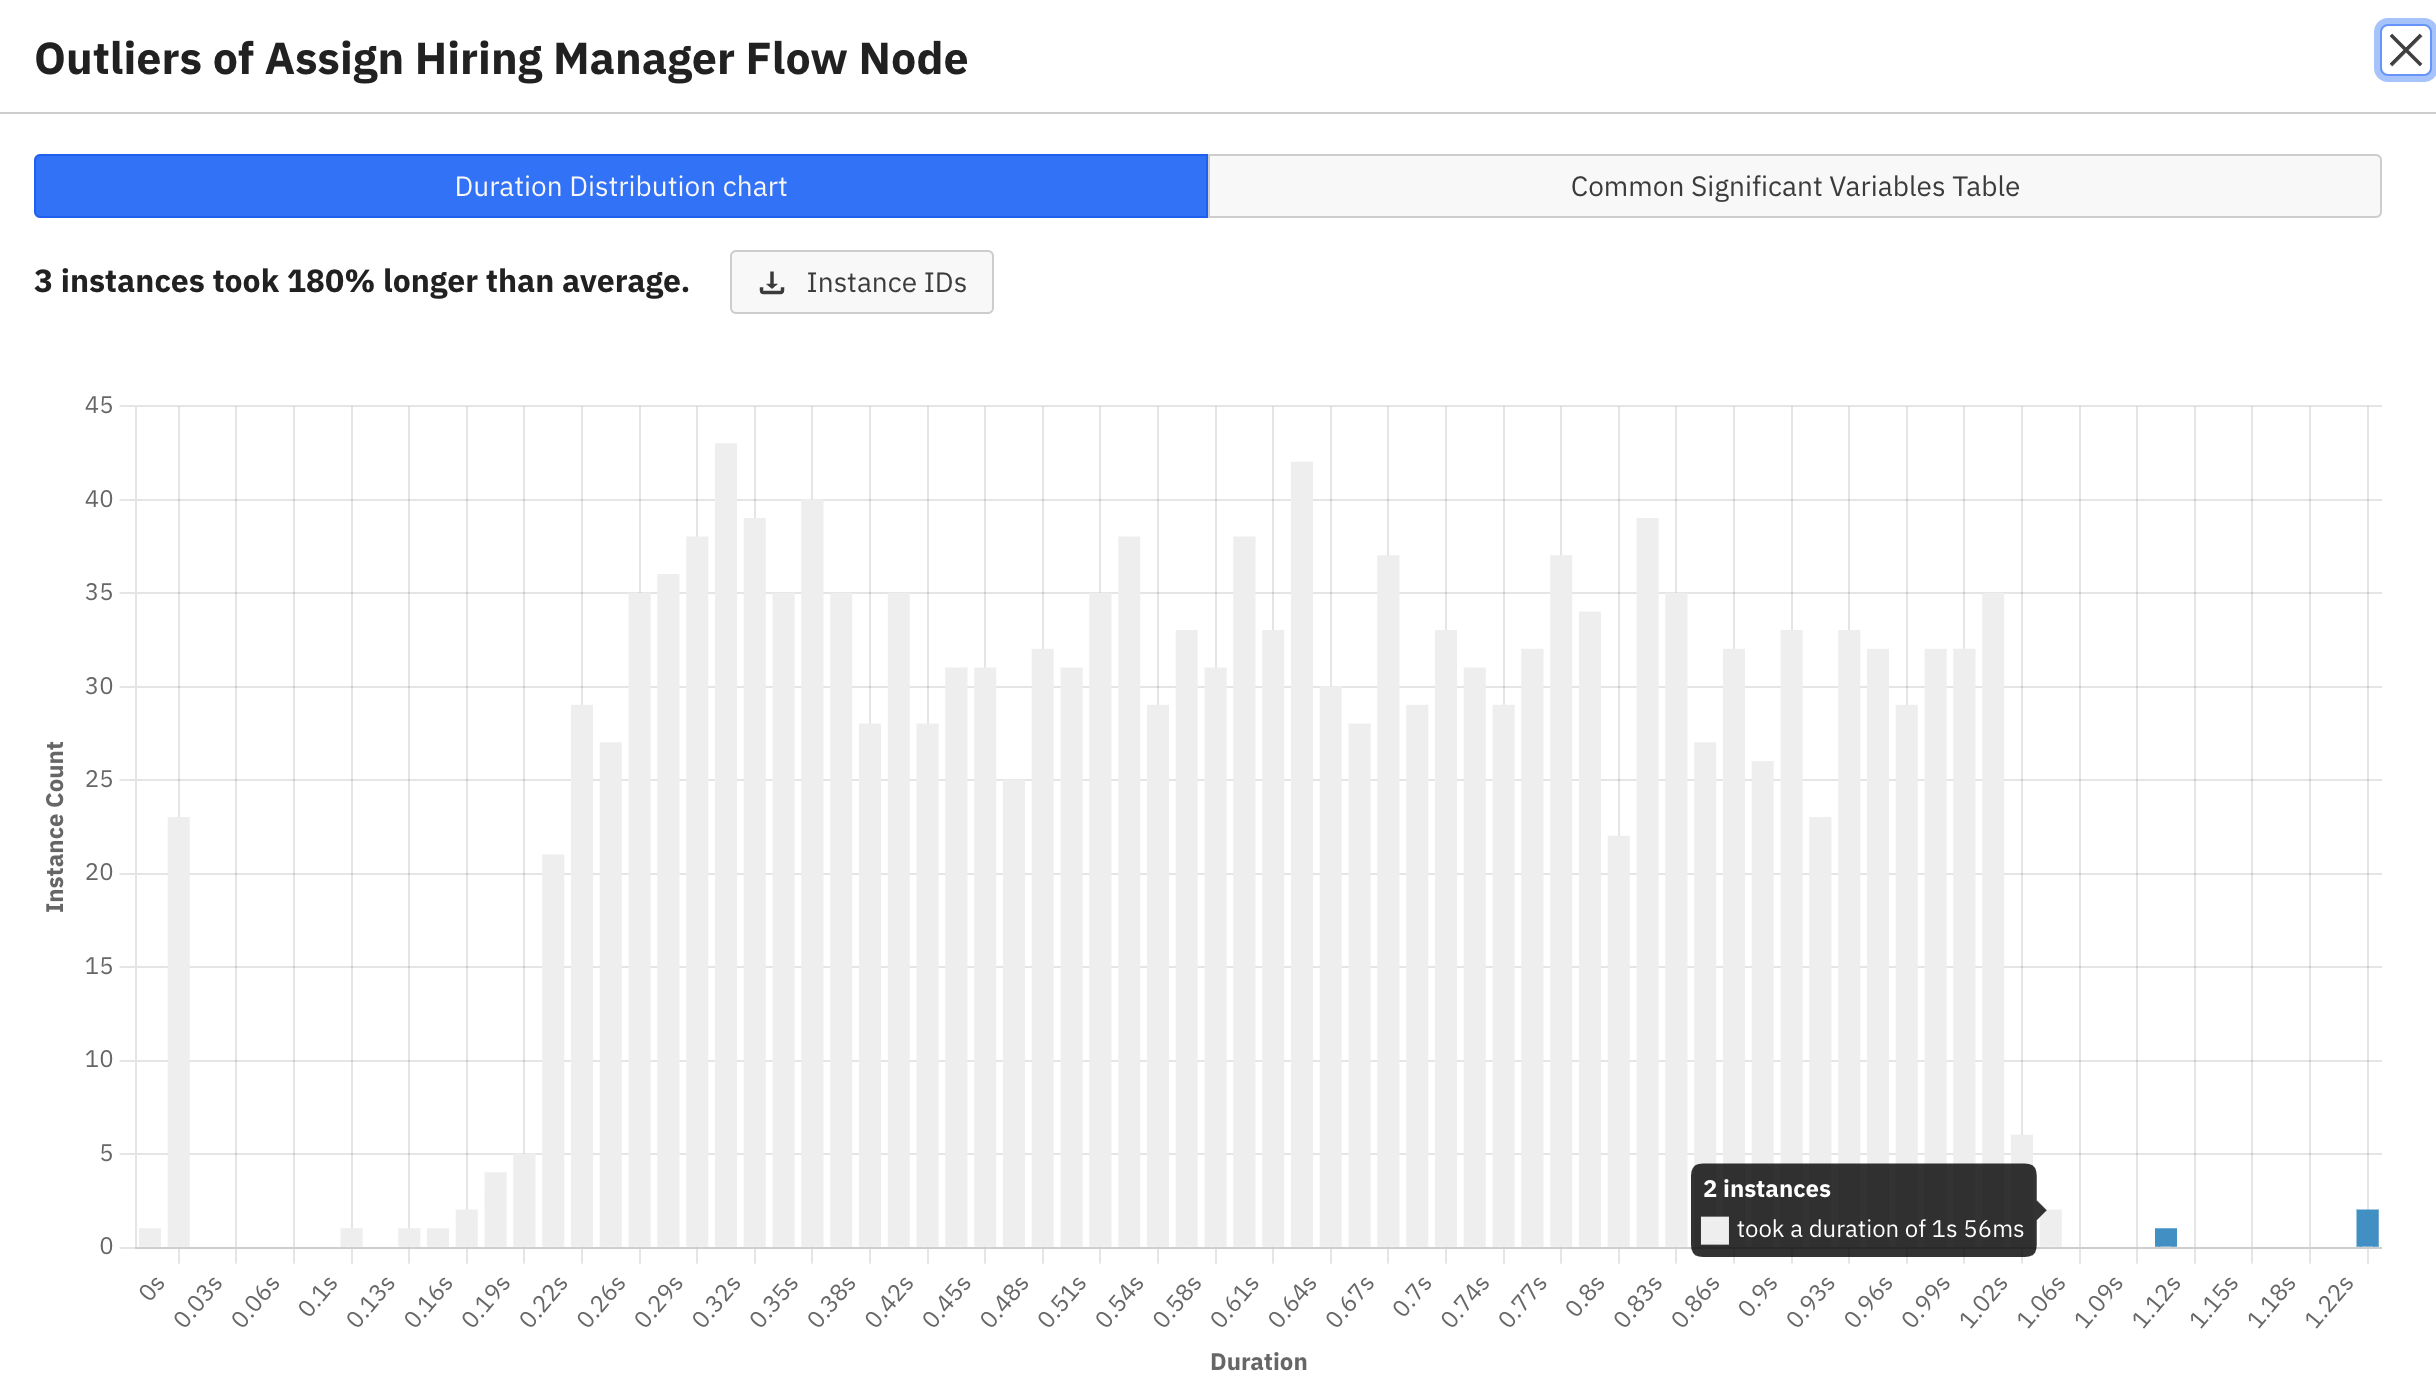
(SH) OR viewing an Outlier Analysis chart
(MH) OR setting a duration goal
(MH) AND the buckets are automatically calculated
(MH) THEN the axes only show whole numbers
(SH) BUT if the "Bucket Size" configuration option is enabled
(SH) THEN the configured bucket size is displayed
(SH) AND the configured bucket units are displayed
(SH) WHEN I enable the "Bucket Size" configuration option
(NTH) THEN the current bucket size is displayed
(SH) AND the current bucket units are displayed
(SH) WHEN I disable the "Bucket Size" configuration option
(SH) THEN the bucket size is recalculated
(SH) AND the bucket units are recalculated
Examples:

Hint
- We have 3 degrees of freedom: number of buckets, bucket size, units displayed, and bucket location
I see 2 solution approaches: a calculation-heavy approach and a visualization-heavy approach
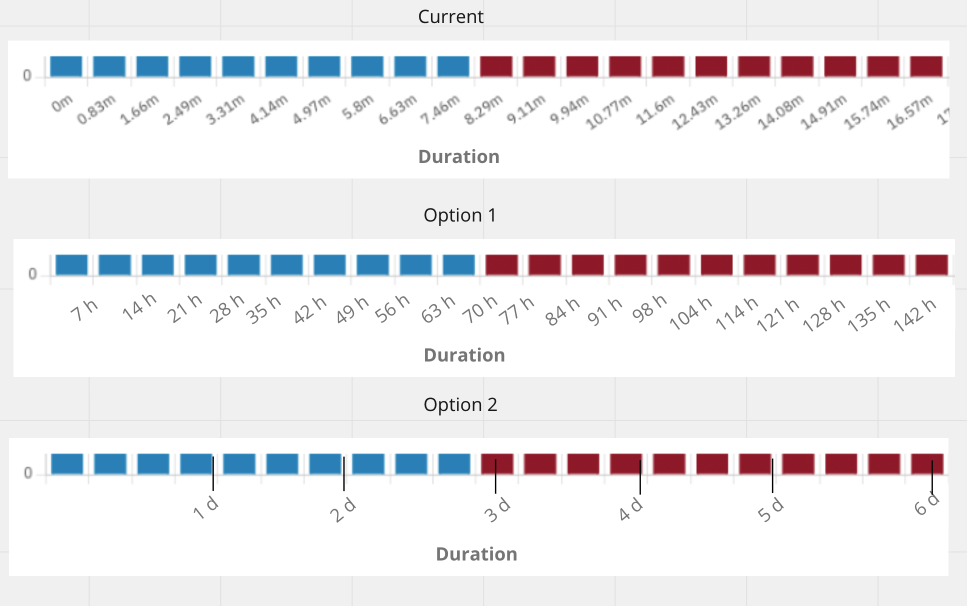
Option 1: Calculate bucket width, dropping the number
Step 1: Calculate range (maxvalue - minvalue)
Step 2: If range < 10, use the 2nd biggest set of units
Step 3: Calculate bucket width (Range/20, always rounding up)
Step 4: Plot graph
Example: Data from 0 to 5 days 15 hours would be plotted in 7-hour increments. Buckets would be displayed in hours, from 0 to 140 hours
To find out what '35 hours' means, the user can still hover over the bar (no change)

Option 2: Decouple the axis labels from the buckets (as in Outlier Analysis)
- Plot the axes and gridlines using the biggest set of units used (e.g. 4d4hr37m would use days)
- Use bucket sizing and placing from the existing automatic algorithm
This is the controller panel for Smart Panels app


[OPT-5920] Readable automatic duration buckets
| Attachment | New: image-2022-01-24-10-37-08-704.png [ 48926 ] | |
| Attachment | New: image-2022-01-24-10-36-29-401.png [ 48927 ] | |
| Attachment | New: image-2022-01-24-10-36-21-982.png [ 48928 ] | |
| Attachment | New: image-2022-01-24-10-35-53-452.png [ 48929 ] | |
| Attachment | New: image-2022-01-24-10-35-40-718.png [ 48930 ] | |
| Description |
Original:
h3. What is the desired functionality that you are missing?
When I view charts showing duration information I want to view readable time buckets So that I can understand how time data is distributed h3. Which problem are you going to solve with this functionality? Duration buckets are difficult to understand, according to one piece of user testing feedback. !image-2022-01-24-10-21-56-533.png|thumbnail! h3. Context: Given, When, Then GIVEN I am viewing a report distributed by duration OR viewing a duration report OR viewing an Outlier Analysis chart OR setting a duration goal THEN the axes only show whole numbers h3. Test Cases: |
New:
h3. What is the desired functionality that you are missing?
When I view charts showing duration information I want to view readable time buckets So that I can understand how time data is distributed h3. Which problem are you going to solve with this functionality? Duration buckets are difficult to understand, according to one piece of user testing feedback. !image-2022-01-24-10-21-56-533.png|thumbnail! h3. Context: Given, When, Then GIVEN I am viewing a report distributed by duration OR viewing a duration report OR viewing an Outlier Analysis chart OR setting a duration goal AND the buckets are automatically calculated THEN the axes only show whole numbers h3. Test Cases: !image-2022-01-24-10-36-21-982.png|thumbnail! !image-2022-01-24-10-36-29-401.png|thumbnail! !image-2022-01-24-10-37-08-704.png|thumbnail! h3. Hint - We have 2 degrees of freedom: number of buckets and bucket size Step 1: Calculate range (maxvalue - minvalue) Step 2: Calculate number of buckets with the top Here's an example: for data distributed across 2 weeks |
| Summary | Original: Readable duration buckets | New: Readable automatic duration buckets |
| Mentioned Roles |
| Mentioned Groups |
| Attachment | New: image-2022-01-24-12-10-51-442.png [ 48937 ] | |
| Description |
Original:
h3. What is the desired functionality that you are missing?
When I view charts showing duration information I want to view readable time buckets So that I can understand how time data is distributed h3. Which problem are you going to solve with this functionality? Duration buckets are difficult to understand, according to one piece of user testing feedback. !image-2022-01-24-10-21-56-533.png|thumbnail! h3. Context: Given, When, Then GIVEN I am viewing a report distributed by duration OR viewing a duration report OR viewing an Outlier Analysis chart OR setting a duration goal AND the buckets are automatically calculated THEN the axes only show whole numbers h3. Test Cases: !image-2022-01-24-10-36-21-982.png|thumbnail! !image-2022-01-24-10-36-29-401.png|thumbnail! !image-2022-01-24-10-37-08-704.png|thumbnail! h3. Hint - We have 2 degrees of freedom: number of buckets and bucket size Step 1: Calculate range (maxvalue - minvalue) Step 2: Calculate number of buckets with the top Here's an example: for data distributed across 2 weeks |
New:
h3. What is the desired functionality that you are missing?
When I view charts showing duration information I want to view readable time buckets So that I can understand how time data is distributed h3. Which problem are you going to solve with this functionality? Duration buckets are difficult to understand, according to one piece of user testing feedback. !image-2022-01-24-10-21-56-533.png|thumbnail! h3. Context: Given, When, Then GIVEN I am viewing a report distributed by duration OR viewing a duration report OR viewing an Outlier Analysis chart OR setting a duration goal AND the buckets are automatically calculated THEN the axes only show whole numbers h3. Examples: !image-2022-01-24-10-36-21-982.png|thumbnail! !image-2022-01-24-10-36-29-401.png|thumbnail! !image-2022-01-24-10-37-08-704.png|thumbnail! h3. Hint - We have 3 degrees of freedom: number of buckets, bucket size, units displayed, and bucket location I see 2 solution approaches: a calculation-heavy approach and a visualization-heavy approach Option 1: Calculate bucket width, dropping the number Step 1: Calculate range (maxvalue - minvalue) Step 2: If range < 10, use the 2nd biggest set of units Step 3: Calculate bucket width (Range/20, always rounding up) Step 4: Plot graph Example: Data from 0 to 5 days 15 hours would be plotted in 7-hour increments. Buckets would be displayed in hours, from 0 to 140 hours To find out what '35 hours' means, the user can still hover over the bar (no change) !image-2022-01-24-12-10-51-442.png|thumbnail! Option 2: Decouple the axis labels from the buckets (as in Outlier Analysis) * Plot the axes and gridlines using the biggest set of units used (e.g. 4d4hr37m would use days) * Use bucket sizing and placing from the existing automatic algorithm |
| Mentioned Roles |
| Mentioned Groups |
| Attachment | New: image-2022-01-24-13-21-39-819.png [ 48944 ] | |
| Description |
Original:
h3. What is the desired functionality that you are missing?
When I view charts showing duration information I want to view readable time buckets So that I can understand how time data is distributed h3. Which problem are you going to solve with this functionality? Duration buckets are difficult to understand, according to one piece of user testing feedback. !image-2022-01-24-10-21-56-533.png|thumbnail! h3. Context: Given, When, Then GIVEN I am viewing a report distributed by duration OR viewing a duration report OR viewing an Outlier Analysis chart OR setting a duration goal AND the buckets are automatically calculated THEN the axes only show whole numbers h3. Examples: !image-2022-01-24-10-36-21-982.png|thumbnail! !image-2022-01-24-10-36-29-401.png|thumbnail! !image-2022-01-24-10-37-08-704.png|thumbnail! h3. Hint - We have 3 degrees of freedom: number of buckets, bucket size, units displayed, and bucket location I see 2 solution approaches: a calculation-heavy approach and a visualization-heavy approach Option 1: Calculate bucket width, dropping the number Step 1: Calculate range (maxvalue - minvalue) Step 2: If range < 10, use the 2nd biggest set of units Step 3: Calculate bucket width (Range/20, always rounding up) Step 4: Plot graph Example: Data from 0 to 5 days 15 hours would be plotted in 7-hour increments. Buckets would be displayed in hours, from 0 to 140 hours To find out what '35 hours' means, the user can still hover over the bar (no change) !image-2022-01-24-12-10-51-442.png|thumbnail! Option 2: Decouple the axis labels from the buckets (as in Outlier Analysis) * Plot the axes and gridlines using the biggest set of units used (e.g. 4d4hr37m would use days) * Use bucket sizing and placing from the existing automatic algorithm |
New:
h3. What is the desired functionality that you are missing?
When I view charts showing duration information I want to view readable time buckets So that I can understand how time data is distributed h3. Which problem are you going to solve with this functionality? Duration buckets are difficult to understand, according to one piece of user testing feedback. !image-2022-01-24-10-21-56-533.png|thumbnail! h3. Context: Given, When, Then GIVEN I am viewing a report distributed by duration OR viewing a duration report OR viewing an Outlier Analysis chart OR setting a duration goal AND the buckets are automatically calculated THEN the axes only show whole numbers h3. Examples: !image-2022-01-24-10-36-21-982.png|thumbnail! !image-2022-01-24-10-36-29-401.png|thumbnail! !image-2022-01-24-10-37-08-704.png|thumbnail! h3. Hint - We have 3 degrees of freedom: number of buckets, bucket size, units displayed, and bucket location I see 2 solution approaches: a calculation-heavy approach and a visualization-heavy approach !image-2022-01-24-13-21-39-819.png|thumbnail! Option 1: Calculate bucket width, dropping the number Step 1: Calculate range (maxvalue - minvalue) Step 2: If range < 10, use the 2nd biggest set of units Step 3: Calculate bucket width (Range/20, always rounding up) Step 4: Plot graph Example: Data from 0 to 5 days 15 hours would be plotted in 7-hour increments. Buckets would be displayed in hours, from 0 to 140 hours To find out what '35 hours' means, the user can still hover over the bar (no change) !image-2022-01-24-12-10-51-442.png|thumbnail! Option 2: Decouple the axis labels from the buckets (as in Outlier Analysis) * Plot the axes and gridlines using the biggest set of units used (e.g. 4d4hr37m would use days) * Use bucket sizing and placing from the existing automatic algorithm |
| Epic Link | New: PRODHUB-4 [ 68503 ] |
| Mentioned Roles |
| Mentioned Groups |