-
Bug Report
-
Resolution: Fixed
-
 L3 - Default
-
None
-
Not defined
Brief summary of the bug. What is it ? Where is it ?
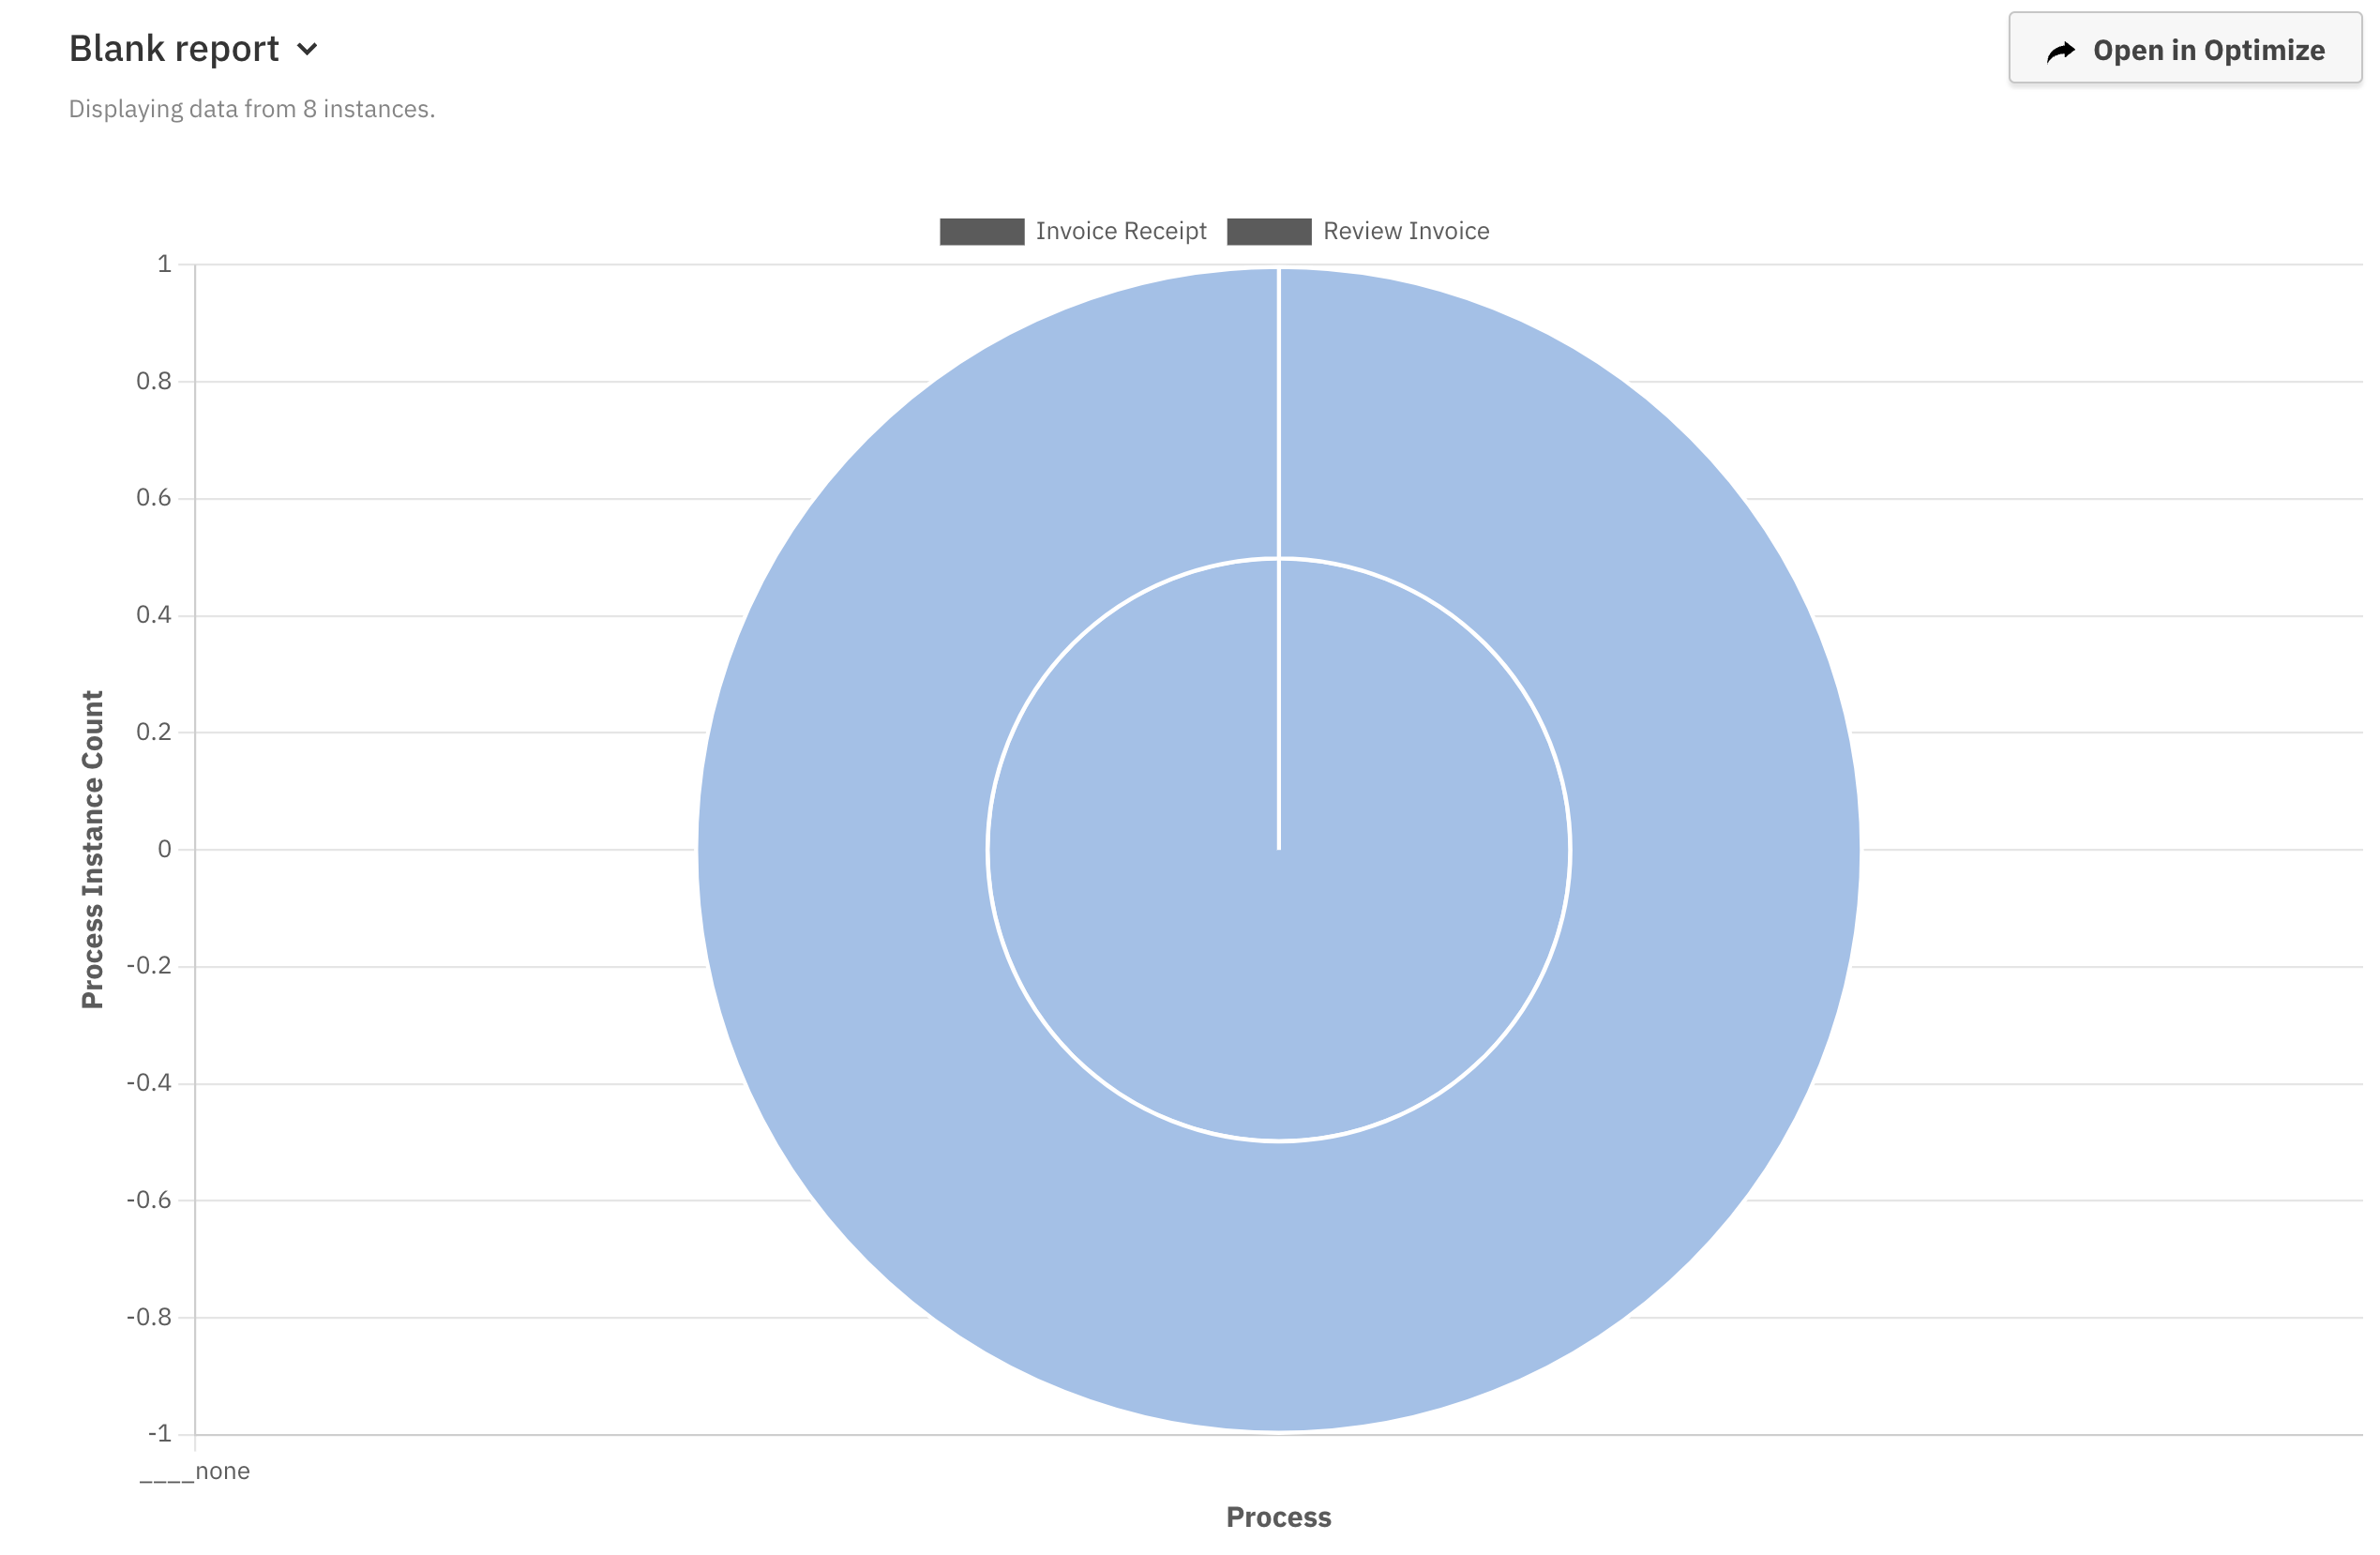
When displaying a pie chart with grouping on a shared report, the chart doesn't render properly (see screenshots). Changing the pie chart to a bar chart renders without any issues
Steps to reproduce:
- Generate a report with at least 2 different processes
- Report Setup:
- View: Process Instance
- Measure: Count
- Group by: Process
- Share the report
- Open the shared URL
Actual result:

Expected result:
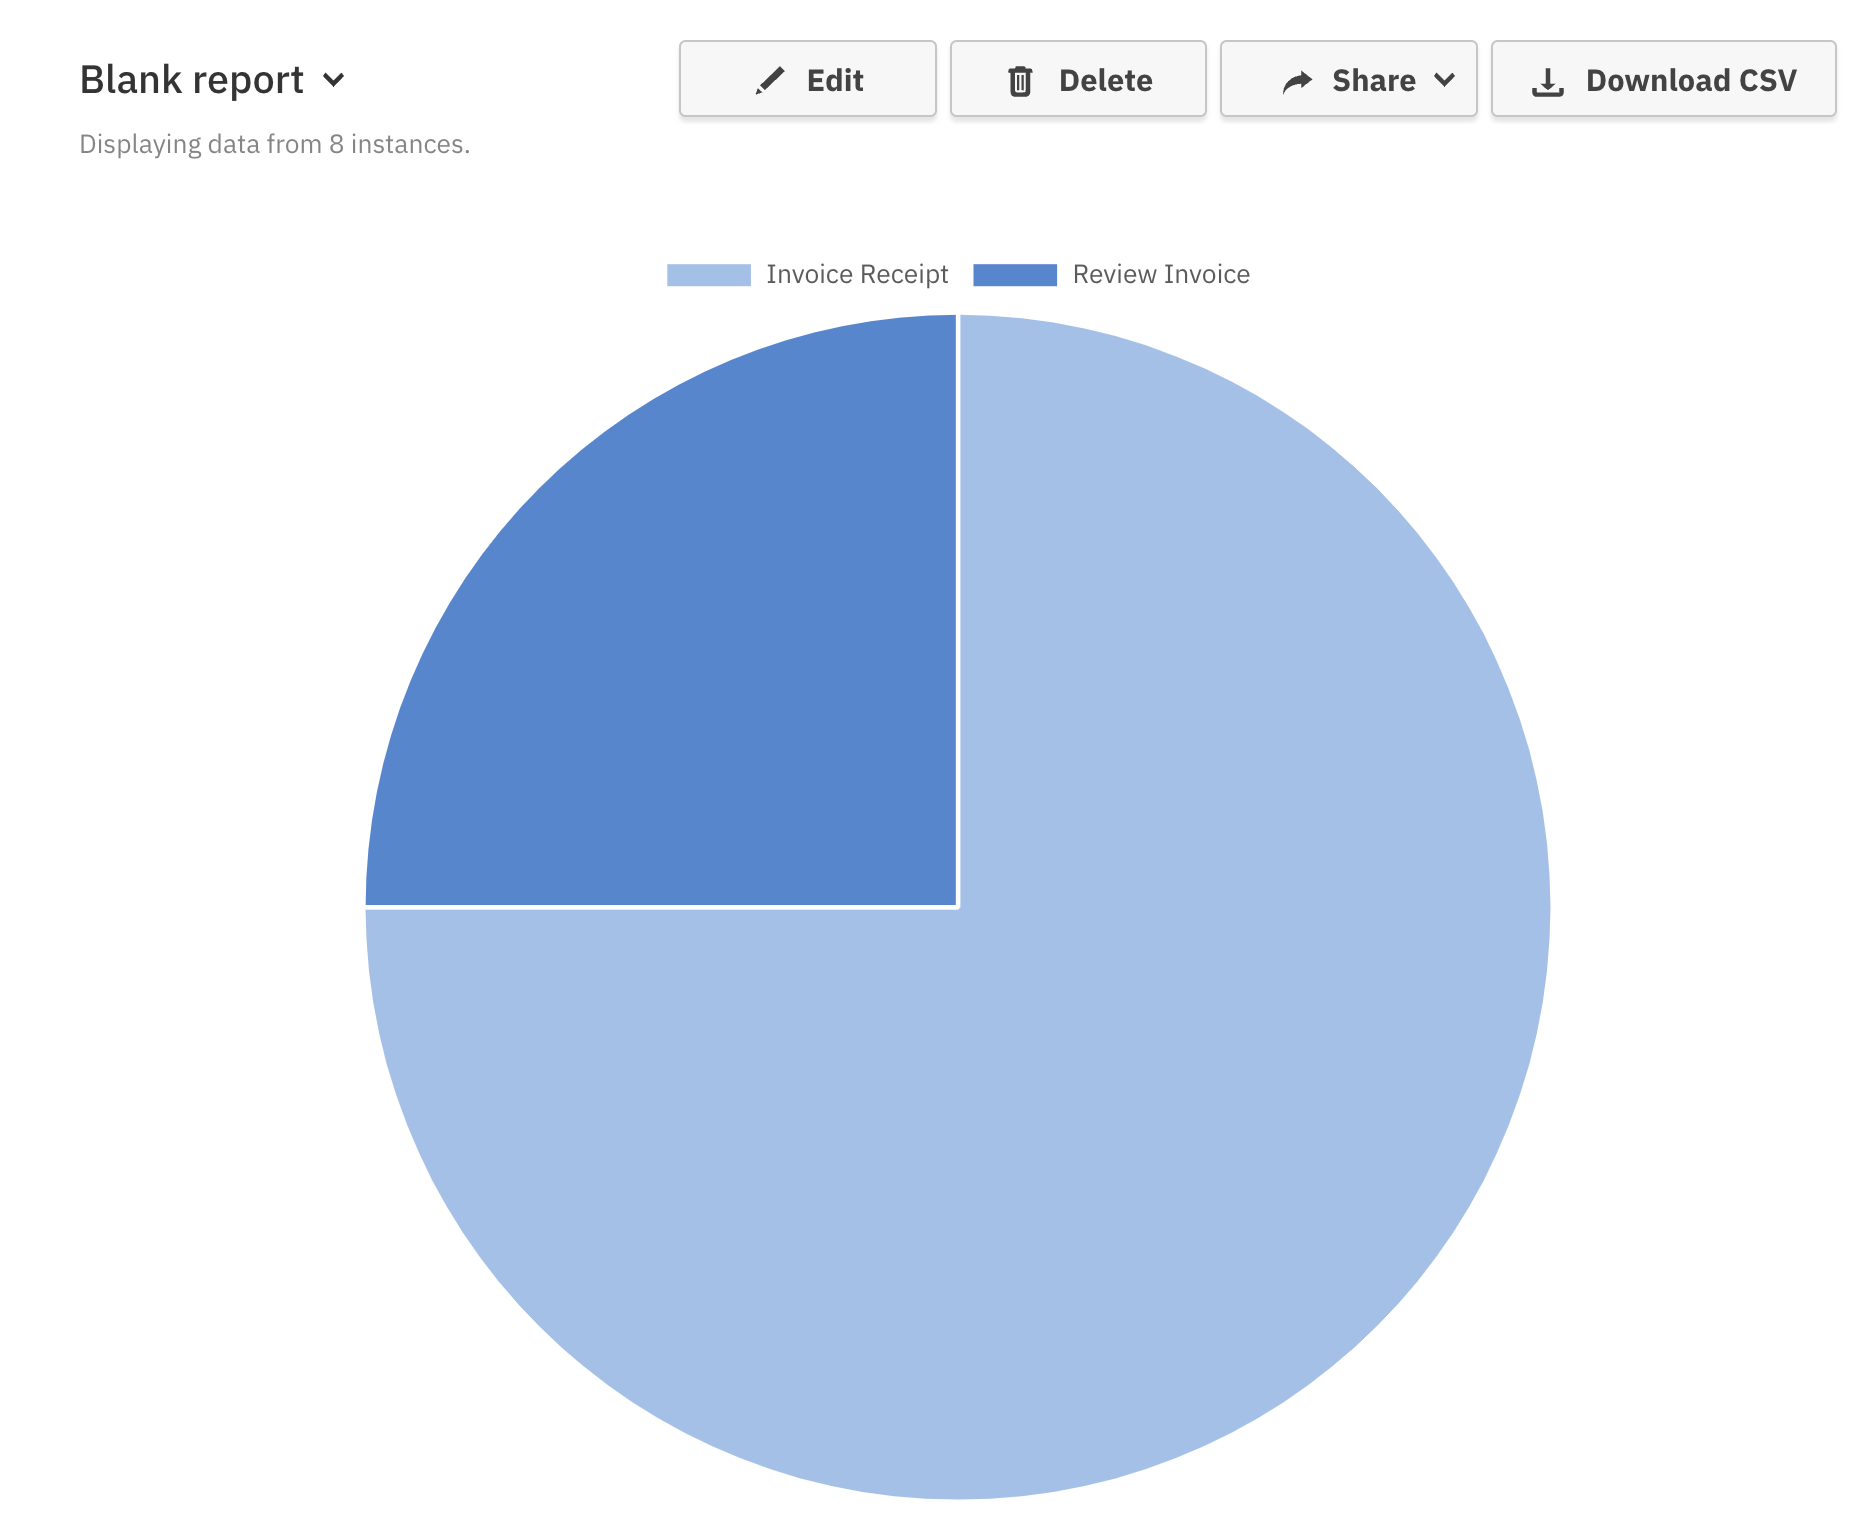
Hint:
In ReportService.js, we have a hack that converts hyperMap reports to normal map reports when evaluating multi process reports. We do not do this conversion when loading shared reports which causes the issue in this ticket. We should either find a solution to remove the hack if possible or make the shared reports do the same conversion.
This is the controller panel for Smart Panels app

[OPT-6118] Pie chart reports don't display properly when shared
| Labels | New: onboarding |
| Assignee | New: Michal Konopski [ michal.konopski ] |
| Description |
Original:
h2. Brief summary of the bug. What is it ? Where is it ?
When displaying a pie chart with grouping on a shared report, the chart doesn't render properly (see screenshots). Changing the pie chart to a bar chart renders without any issues h2. Steps to reproduce: # Generate a report with at least 2 different processes # Report Setup: ## View: Process Instance ## Measure: Count ## Group by: Process # Share the report # Open the shared URL h3. Actual result: !image-2022-04-11-12-28-12-653.png|width=378,height=247! h3. Expected result: !image-2022-04-11-12-29-43-248.png|width=423,height=348! |
New:
h2. Brief summary of the bug. What is it ? Where is it ?
When displaying a pie chart with grouping on a shared report, the chart doesn't render properly (see screenshots). Changing the pie chart to a bar chart renders without any issues h2. Steps to reproduce: # Generate a report with at least 2 different processes # Report Setup: ## View: Process Instance ## Measure: Count ## Group by: Process # Share the report # Open the shared URL h3. Actual result: !image-2022-04-11-12-28-12-653.png|width=378,height=247! h3. Expected result: !image-2022-04-11-12-29-43-248.png|width=423,height=348! *Hint:* In [ReportService.js,|https://github.com/camunda/camunda-optimize/blob/b9ea3af93028e43e65058fab40560f2aff55899b/client/src/modules/services/reportService.js] we have a hack that converts hyperMap reports to normal map reports when evaluating multi process reports. We do not do this conversion when loading shared repots which causes the issue in this ticket. We should either find a solution to remove the hack if possible or make the shared reports do the same conversion. |
| Description |
Original:
h2. Brief summary of the bug. What is it ? Where is it ?
When displaying a pie chart with grouping on a shared report, the chart doesn't render properly (see screenshots). Changing the pie chart to a bar chart renders without any issues h2. Steps to reproduce: # Generate a report with at least 2 different processes # Report Setup: ## View: Process Instance ## Measure: Count ## Group by: Process # Share the report # Open the shared URL h3. Actual result: !image-2022-04-11-12-28-12-653.png|width=378,height=247! h3. Expected result: !image-2022-04-11-12-29-43-248.png|width=423,height=348! *Hint:* In [ReportService.js,|https://github.com/camunda/camunda-optimize/blob/b9ea3af93028e43e65058fab40560f2aff55899b/client/src/modules/services/reportService.js] we have a hack that converts hyperMap reports to normal map reports when evaluating multi process reports. We do not do this conversion when loading shared repots which causes the issue in this ticket. We should either find a solution to remove the hack if possible or make the shared reports do the same conversion. |
New:
h2. Brief summary of the bug. What is it ? Where is it ?
When displaying a pie chart with grouping on a shared report, the chart doesn't render properly (see screenshots). Changing the pie chart to a bar chart renders without any issues h2. Steps to reproduce: # Generate a report with at least 2 different processes # Report Setup: ## View: Process Instance ## Measure: Count ## Group by: Process # Share the report # Open the shared URL h3. Actual result: !image-2022-04-11-12-28-12-653.png|width=378,height=247! h3. Expected result: !image-2022-04-11-12-29-43-248.png|width=423,height=348! *Hint:* In [ReportService.js,|https://github.com/camunda/camunda-optimize/blob/b9ea3af93028e43e65058fab40560f2aff55899b/client/src/modules/services/reportService.js] we have a hack that converts hyperMap reports to normal map reports when evaluating multi process reports. We do not do this conversion when loading shared reports which causes the issue in this ticket. We should either find a solution to remove the hack if possible or make the shared reports do the same conversion. |
| Status | Original: Open [ 1 ] | New: Ready [ 10005 ] |
| Status | Original: Ready [ 10005 ] | New: In Development [ 10312 ] |
| Assignee | Original: Michal Konopski [ michal.konopski ] | New: Omran Abazeed [ omran.abazeed ] |
| Status | Original: In Development [ 10312 ] | New: In Review [ 10212 ] |
| Status | Original: In Review [ 10212 ] | New: Ready [ 10005 ] |
| Assignee | Original: Omran Abazeed [ omran.abazeed ] | New: Michal Konopski [ michal.konopski ] |