-
Epic
-
Resolution: Fixed
-
 L3 - Default
-
None
-
None
-
1
-
Not defined
-
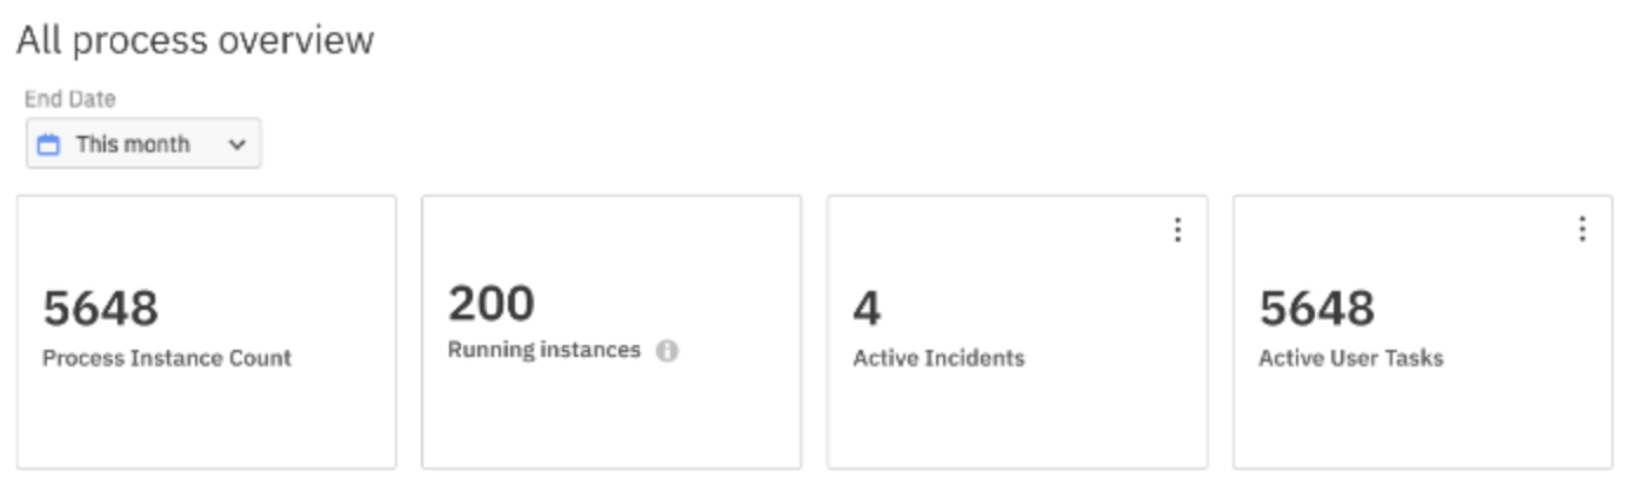
Management Dashboard

This is the controller panel for Smart Panels app
[OPT-6142] Management Dashboard
| Epic Name | Original: KPI Overview | New: Management Dashboard |
| Epic Child |
New:
|
| Description |
Original:
h3. Value Proposition Statement
The KPI overview will help process owners identify which processes are healthy and which processes need attention h3. User Problem As a process owner, I want to see the health of all my processes so I know which one to focus on, but I run into the following problems: - The existing time-based goal interface is highly limited (only 2 options, no filtering, whole process instance duration only) - Reports can be used to create highly customizable cost, quality, or other business KPIs h3. Use Cases - (MH) Users can set a new KPI for a process - (MH) Users can categorize their KPI (e.g., time, quality, other) - (MH) Users can see an overview of KPI status across all processes - (MH) Users can quickly check which KPIs have been met/not met - (SH) Users can customize which KPIs display in the overview - (SH) Users with existing time-based goals don't lose any of their work when upgrading h3. Implementation Notes Design Brief [Solution Kickoff|https://confluence.camunda.com/display/CO/2022-04-12+Solution+Kickoff%3A+Alert+Overview] h4. Open Questions ((*) = recommendation) * h3. Success Metrics * Number of update notifications sent * Update notification conversion rate h3. Links * [Value Proposition Slide](https://docs.google.com/presentation/d/18z83aBhjip5z9moiTbNHDim-o1a5WNaQEWx17lMQBfk/edit#slide=id.g117e9bae166_0_7) * [ProdHub Issue|https://github.com/camunda/product-hub/issues/68] (Github) h3. Design * NEEDS LINK * Design Reviewed - Design Needed * Designer Assigned - [~asia.malina] h3. Implementation * See linked tickets h3. Documentation * TBC |
New:
h3. Value Proposition Statement
Help PACE leaders evaluate the success of ongoing Camunda processes by providing a one-stop shop for viewing process portfolio health. h3. User Problem - Customers may have several dashboards with data from different processes. It is unfeasible to review each process to find out what to do. - Higher-level leadership need a tailored report for successful interaction. - Assigning resources is difficult when the business value and opportunity costs are unknown h3. Use Cases - (MH) Users can view aggregate statistics (e.g. root PI, DI, active instances, active incidents, open tasks) - -(MH) Users can view basic KPIs for each process (P90 duration, throughput, incident rate)- -- Possible as part of KPI Overview - (SH) The number of processes in a multi-process report is configurable - (NTH) Users can see statistics distributed by process (e.g. open tasks, active PI, incidents) h3. Implementation Notes Design Brief Solution Kickoff h4. Open Questions ((*) = recommendation) * h3. Success Metrics * Number of process pageviews * Monthly Active User count (new persona) h3. Links * [Value Proposition Slide](https://docs.google.com/presentation/d/18z83aBhjip5z9moiTbNHDim-o1a5WNaQEWx17lMQBfk/edit#slide=id.gcfa7075777_1_61) * [ProdHub Issue|https://github.com/camunda/product-hub/issues/68] (Github) h3. Design * NEEDS LINK * Design Reviewed - Design Needed * Designer Assigned - [~asia.malina] h3. Implementation * See linked tickets h3. Documentation * TBC |
| Description |
Original:
h3. Value Proposition Statement
Help PACE leaders evaluate the success of ongoing Camunda processes by providing a one-stop shop for viewing process portfolio health. h3. User Problem - Customers may have several dashboards with data from different processes. It is unfeasible to review each process to find out what to do. - Higher-level leadership need a tailored report for successful interaction. - Assigning resources is difficult when the business value and opportunity costs are unknown h3. Use Cases - (MH) Users can view aggregate statistics (e.g. root PI, DI, active instances, active incidents, open tasks) - -(MH) Users can view basic KPIs for each process (P90 duration, throughput, incident rate)- -- Possible as part of KPI Overview - (SH) The number of processes in a multi-process report is configurable - (NTH) Users can see statistics distributed by process (e.g. open tasks, active PI, incidents) h3. Implementation Notes Design Brief Solution Kickoff h4. Open Questions ((*) = recommendation) * h3. Success Metrics * Number of process pageviews * Monthly Active User count (new persona) h3. Links * [Value Proposition Slide](https://docs.google.com/presentation/d/18z83aBhjip5z9moiTbNHDim-o1a5WNaQEWx17lMQBfk/edit#slide=id.gcfa7075777_1_61) * [ProdHub Issue|https://github.com/camunda/product-hub/issues/68] (Github) h3. Design * NEEDS LINK * Design Reviewed - Design Needed * Designer Assigned - [~asia.malina] h3. Implementation * See linked tickets h3. Documentation * TBC |
New:
h3. Value Proposition Statement
Help PACE leaders evaluate the success of ongoing Camunda processes by providing a one-stop shop for viewing process portfolio health. h3. User Problem - Customers may have several dashboards with data from different processes. It is unfeasible to review each process to find out what to do. - Higher-level leadership need a tailored report for successful interaction. - Assigning resources is difficult when the business value and opportunity costs are unknown h3. Use Cases - (MH) Users can view aggregate statistics (e.g. root PI, DI, active instances, active incidents, open tasks) - (SH) The number of processes in a multi-process report is configurable - (NTH) Users can see statistics distributed by process (e.g. open tasks, active PI, incidents) h3. Implementation Notes Design Brief Solution Kickoff h4. Open Questions ((*) = recommendation) * How do we calculate statistics for customers with heavy Camunda usage? * What are the right statistics? h3. Success Metrics * Number of process pageviews * Monthly Active User count (new persona) h3. Links * [Value Proposition Slide](https://docs.google.com/presentation/d/18z83aBhjip5z9moiTbNHDim-o1a5WNaQEWx17lMQBfk/edit#slide=id.gcfa7075777_1_61) * [ProdHub Issue|https://github.com/camunda/product-hub/issues/68] (Github) h3. Design * NEEDS LINK * Design Reviewed - Design Needed * Designer Assigned - [~asia.malina] h3. Implementation * See linked tickets h3. Documentation * TBC |
| Attachment | New: Sample Stats.png [ 51540 ] |
| Description |
Original:
h3. Value Proposition Statement
Help PACE leaders evaluate the success of ongoing Camunda processes by providing a one-stop shop for viewing process portfolio health. h3. User Problem - Customers may have several dashboards with data from different processes. It is unfeasible to review each process to find out what to do. - Higher-level leadership need a tailored report for successful interaction. - Assigning resources is difficult when the business value and opportunity costs are unknown h3. Use Cases - (MH) Users can view aggregate statistics (e.g. root PI, DI, active instances, active incidents, open tasks) - (SH) The number of processes in a multi-process report is configurable - (NTH) Users can see statistics distributed by process (e.g. open tasks, active PI, incidents) h3. Implementation Notes Design Brief Solution Kickoff h4. Open Questions ((*) = recommendation) * How do we calculate statistics for customers with heavy Camunda usage? * What are the right statistics? h3. Success Metrics * Number of process pageviews * Monthly Active User count (new persona) h3. Links * [Value Proposition Slide](https://docs.google.com/presentation/d/18z83aBhjip5z9moiTbNHDim-o1a5WNaQEWx17lMQBfk/edit#slide=id.gcfa7075777_1_61) * [ProdHub Issue|https://github.com/camunda/product-hub/issues/68] (Github) h3. Design * NEEDS LINK * Design Reviewed - Design Needed * Designer Assigned - [~asia.malina] h3. Implementation * See linked tickets h3. Documentation * TBC |
New:
h3. Value Proposition Statement
Help PACE leaders evaluate the success of ongoing Camunda processes by providing a one-stop shop for viewing process portfolio health. h3. User Problem - Customers may have several dashboards with data from different processes. It is unfeasible to review each process to find out what to do. - Higher-level leadership need a tailored report for successful interaction. - Assigning resources is difficult when the business value and opportunity costs are unknown h3. Use Cases - (MH) Users can view aggregate statistics (e.g. root PI, DI, active instances, active incidents, open tasks) - (SH) The number of processes in a multi-process report is configurable - (NTH) Users can see statistics distributed by process (e.g. open tasks, active PI, incidents) h3. Implementation Notes Design Brief Solution Kickoff h4. Open Questions ((*) = recommendation) * How do we calculate statistics for customers with heavy Camunda usage? * What are the right statistics? h3. Success Metrics * Number of process pageviews * Monthly Active User count (new persona) h3. Links * [Value Proposition Slide]([https://docs.google.com/presentation/d/18z83aBhjip5z9moiTbNHDim-o1a5WNaQEWx17lMQBfk/edit#slide=id.gcfa7075777_1_61]) * [ProdHub Issue|https://github.com/camunda/product-hub/issues/68] (Github) h3. Design * NEEDS LINK * Design Reviewed - Design Needed * Designer Assigned - [~asia.malina] !Sample Stats.png|width=564,height=195! h3. Implementation * See linked tickets h3. Documentation * TBC |
| Description |
Original:
h3. Value Proposition Statement
Help PACE leaders evaluate the success of ongoing Camunda processes by providing a one-stop shop for viewing process portfolio health. h3. User Problem - Customers may have several dashboards with data from different processes. It is unfeasible to review each process to find out what to do. - Higher-level leadership need a tailored report for successful interaction. - Assigning resources is difficult when the business value and opportunity costs are unknown h3. Use Cases - (MH) Users can view aggregate statistics (e.g. root PI, DI, active instances, active incidents, open tasks) - (SH) The number of processes in a multi-process report is configurable - (NTH) Users can see statistics distributed by process (e.g. open tasks, active PI, incidents) h3. Implementation Notes Design Brief Solution Kickoff h4. Open Questions ((*) = recommendation) * How do we calculate statistics for customers with heavy Camunda usage? * What are the right statistics? h3. Success Metrics * Number of process pageviews * Monthly Active User count (new persona) h3. Links * [Value Proposition Slide]([https://docs.google.com/presentation/d/18z83aBhjip5z9moiTbNHDim-o1a5WNaQEWx17lMQBfk/edit#slide=id.gcfa7075777_1_61]) * [ProdHub Issue|https://github.com/camunda/product-hub/issues/68] (Github) h3. Design * NEEDS LINK * Design Reviewed - Design Needed * Designer Assigned - [~asia.malina] !Sample Stats.png|width=564,height=195! h3. Implementation * See linked tickets h3. Documentation * TBC |
New:
h3. Value Proposition Statement
Help PACE leaders evaluate the success of ongoing Camunda processes by providing a one-stop shop for viewing process portfolio health. h3. User Problem - Customers may have several dashboards with data from different processes. It is unfeasible to review each process to find out what to do. - Higher-level leadership need a tailored report for successful interaction. - Assigning resources is difficult when the business value and opportunity costs are unknown h3. Use Cases - (MH) Users can view aggregate statistics (e.g. root PI, DI, active instances, active incidents, open tasks) - (SH) The number of processes in a multi-process report is configurable - (NTH) Users can see statistics distributed by process (e.g. open tasks, active PI, incidents) h3. Implementation Notes Design Brief Solution Kickoff h4. Open Questions ((*) = recommendation) * How do we calculate statistics for customers with heavy Camunda usage? * What are the right statistics? h3. Success Metrics * Number of process pageviews * Monthly Active User count (new persona) h3. Links * [ProdHub Issue|https://github.com/camunda/product-hub/issues/68] (Github) h3. Design * NEEDS LINK * Design Reviewed - Design Needed * Designer Assigned - [~asia.malina] !Sample Stats.png|width=564,height=195! h3. Implementation * See linked tickets h3. Documentation * TBC |
| Description |
Original:
h3. Value Proposition Statement
Help PACE leaders evaluate the success of ongoing Camunda processes by providing a one-stop shop for viewing process portfolio health. h3. User Problem - Customers may have several dashboards with data from different processes. It is unfeasible to review each process to find out what to do. - Higher-level leadership need a tailored report for successful interaction. - Assigning resources is difficult when the business value and opportunity costs are unknown h3. Use Cases - (MH) Users can view aggregate statistics (e.g. root PI, DI, active instances, active incidents, open tasks) - (SH) The number of processes in a multi-process report is configurable - (NTH) Users can see statistics distributed by process (e.g. open tasks, active PI, incidents) h3. Implementation Notes Design Brief Solution Kickoff h4. Open Questions ((*) = recommendation) * How do we calculate statistics for customers with heavy Camunda usage? * What are the right statistics? h3. Success Metrics * Number of process pageviews * Monthly Active User count (new persona) h3. Links * [ProdHub Issue|https://github.com/camunda/product-hub/issues/68] (Github) h3. Design * NEEDS LINK * Design Reviewed - Design Needed * Designer Assigned - [~asia.malina] !Sample Stats.png|width=564,height=195! h3. Implementation * See linked tickets h3. Documentation * TBC |
New:
h3. Value Proposition Statement
Help PACE leaders evaluate the success of ongoing Camunda processes by providing a one-stop shop for viewing process portfolio health. h3. User Problem - Customers may have several dashboards with data from different processes. It is unfeasible to review each process to find out what to do. - Higher-level leadership need a tailored report for successful interaction. - Assigning resources is difficult when the business value and opportunity costs are unknown h3. Use Cases - (MH) Users can view aggregate statistics (e.g. root PI, DI, active instances, active incidents, open tasks) - (SH) The number of processes in a multi-process report is configurable - (NTH) Users can see statistics distributed by process (e.g. open tasks, active PI, incidents) h3. Implementation Notes Design Brief Solution Kickoff h4. Open Questions ((*) = recommendation) * How do we calculate statistics for customers with heavy Camunda usage? * What are the right statistics? h3. Success Metrics * Number of process pageviews * Monthly Active User count (new persona) h3. Links * [ProdHub Issue|https://github.com/camunda/product-hub/issues/68] (Github) * [Value Proposition Slide|https://docs.google.com/presentation/d/18z83aBhjip5z9moiTbNHDim-o1a5WNaQEWx17lMQBfk/edit#slide=id.g1253b8e3f0c_0_134] h3. Design * NEEDS LINK * Design Reviewed - Design Needed * Designer Assigned - [~asia.malina] !Sample Stats.png|width=564,height=195! h3. Implementation * See linked tickets h3. Documentation * TBC |
| Description |
Original:
h3. Value Proposition Statement
Help PACE leaders evaluate the success of ongoing Camunda processes by providing a one-stop shop for viewing process portfolio health. h3. User Problem - Customers may have several dashboards with data from different processes. It is unfeasible to review each process to find out what to do. - Higher-level leadership need a tailored report for successful interaction. - Assigning resources is difficult when the business value and opportunity costs are unknown h3. Use Cases - (MH) Users can view aggregate statistics (e.g. root PI, DI, active instances, active incidents, open tasks) - (SH) The number of processes in a multi-process report is configurable - (NTH) Users can see statistics distributed by process (e.g. open tasks, active PI, incidents) h3. Implementation Notes Design Brief Solution Kickoff h4. Open Questions ((*) = recommendation) * How do we calculate statistics for customers with heavy Camunda usage? * What are the right statistics? h3. Success Metrics * Number of process pageviews * Monthly Active User count (new persona) h3. Links * [ProdHub Issue|https://github.com/camunda/product-hub/issues/68] (Github) * [Value Proposition Slide|https://docs.google.com/presentation/d/18z83aBhjip5z9moiTbNHDim-o1a5WNaQEWx17lMQBfk/edit#slide=id.g1253b8e3f0c_0_134] h3. Design * NEEDS LINK * Design Reviewed - Design Needed * Designer Assigned - [~asia.malina] !Sample Stats.png|width=564,height=195! h3. Implementation * See linked tickets h3. Documentation * TBC |
New:
h3. Value Proposition Statement
Help PACE leaders evaluate the success of ongoing Camunda processes by providing a one-stop shop for viewing process portfolio health. h3. User Problem - Customers may have several dashboards with data from different processes. It is unfeasible to review each process to find out what to do. - Higher-level leadership need a tailored report for successful interaction. - Assigning resources is difficult when the business value and opportunity costs are unknown h3. Use Cases - (MH) Users can view aggregate statistics (e.g. root PI, DI, active instances, active incidents, open tasks) - (SH) The number of processes in a multi-process report is configurable - (NTH) Users can see statistics distributed by process (e.g. open tasks, active PI, incidents) - (NTH) Users can set targets on each of these reports h3. Implementation Notes Design Brief Solution Kickoff h4. Open Questions ((*) = recommendation) * How do we calculate statistics for customers with heavy Camunda usage? * What are the right statistics? h3. Success Metrics * Number of process pageviews * Monthly Active User count (new persona) h3. Links * [ProdHub Issue|https://github.com/camunda/product-hub/issues/68] (Github) * [Value Proposition Slide|https://docs.google.com/presentation/d/18z83aBhjip5z9moiTbNHDim-o1a5WNaQEWx17lMQBfk/edit#slide=id.g1253b8e3f0c_0_134] h3. Design * NEEDS LINK * Design Reviewed - Design Needed * Designer Assigned - [~asia.malina] !Sample Stats.png|width=564,height=195! h3. Implementation * See linked tickets h3. Documentation * TBC |