-
Bug Report
-
Resolution: Cannot Reproduce
-
 L2 - Critical
-
3.9.0-alpha2
-
None
-
None
-
Not defined
Brief summary of the bug. What is it ? Where is it ?
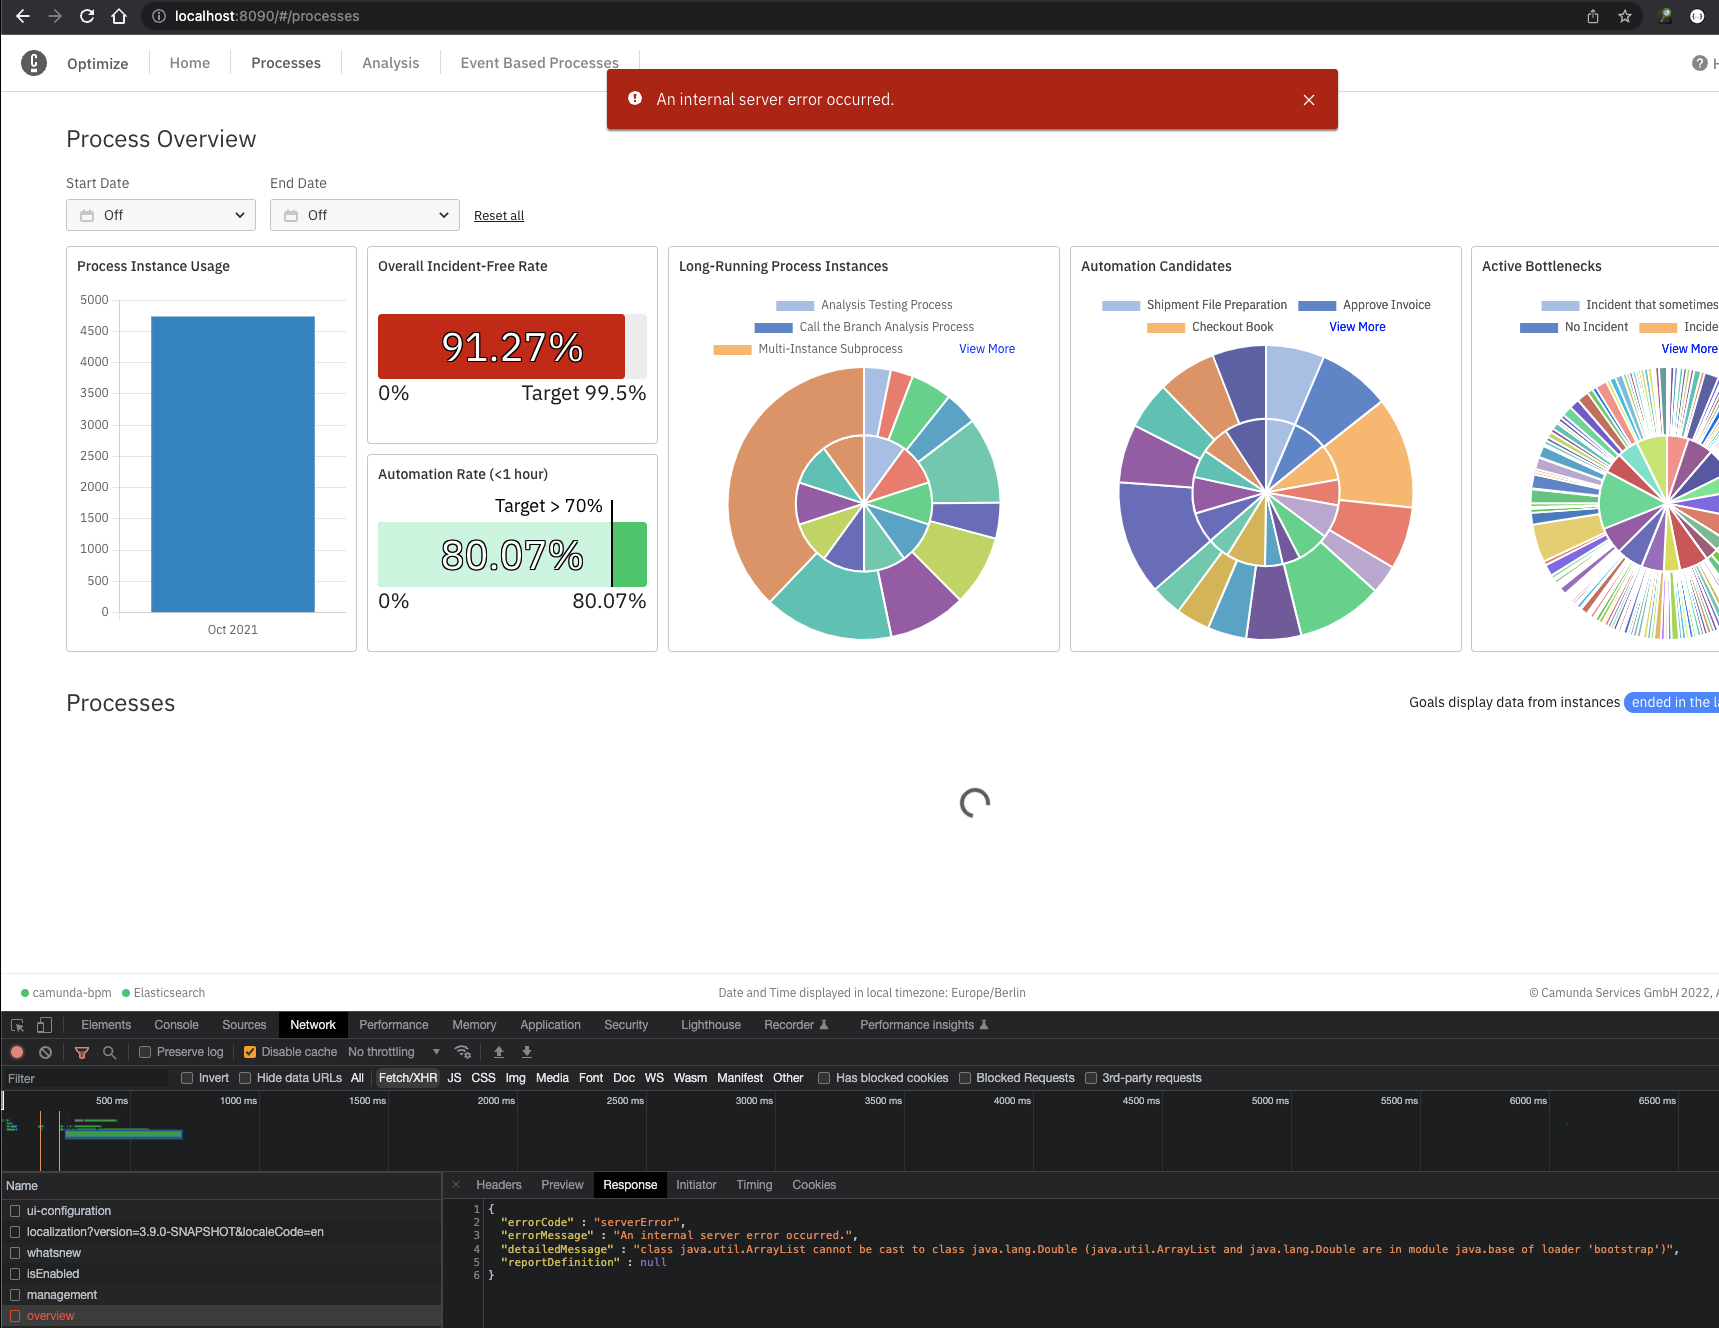
Steps to reproduce:
1. Create a dashboard using the "Process Portfolio Overview " template
2. Go to the Process Page
Actual result:
3. Listing the processes fails with an error and no processes listed, see screenshot.
Expected result:
It should work fine ![]()
Hint:
The report template "Are we resolving incidents fast enough?" used in this dashboard is marked as kpiReport although it is a multi-measure report and thus not allowed to be a kpi report.
See https://github.com/camunda/camunda-optimize/blob/master/client/src/components/Home/modals/DashboardTemplateModal.js#L1037
We also need to check the other multi process reports, the one with the key "dashboard.templates.durationSLI" seems likely to cause the same issue as it's a multi process report flagged as kpi Report.
This is the controller panel for Smart Panels app
[OPT-6273] Creating a Portfolio Performance Overview Dashboard causes Process Overview Page to fail
| Description |
Original:
h2. Brief summary of the bug. What is it ? Where is it ?
h2. Steps to reproduce: 1. Create a dashboard using the "Process Portfolio Overview " template 2. Go to the Process Page h3. Actual result: 3. Listing the processes fails with this error: h3. Expected result: It should work fine :) h3. Hint: The report template "Are we resolving incidents fast enough?" used in this dashboard is marked as kpiReport although it is a multi-measure report and thus not allowed to be a kpi report. |
New:
h2. Brief summary of the bug. What is it ? Where is it ?
h2. Steps to reproduce: 1. Create a dashboard using the "Process Portfolio Overview " template 2. Go to the Process Page h3. Actual result: 3. Listing the processes fails with this error: h3. Expected result: It should work fine :) h3. Hint: The report template "Are we resolving incidents fast enough?" used in this dashboard is marked as kpiReport although it is a multi-measure report and thus not allowed to be a kpi report. See https://github.com/camunda/camunda-optimize/blob/master/client/src/components/Home/modals/DashboardTemplateModal.js#L1037 |
| Description |
Original:
h2. Brief summary of the bug. What is it ? Where is it ?
h2. Steps to reproduce: 1. Create a dashboard using the "Process Portfolio Overview " template 2. Go to the Process Page h3. Actual result: 3. Listing the processes fails with this error: h3. Expected result: It should work fine :) h3. Hint: The report template "Are we resolving incidents fast enough?" used in this dashboard is marked as kpiReport although it is a multi-measure report and thus not allowed to be a kpi report. See https://github.com/camunda/camunda-optimize/blob/master/client/src/components/Home/modals/DashboardTemplateModal.js#L1037 |
New:
h2. Brief summary of the bug. What is it ? Where is it ?
h2. Steps to reproduce: 1. Create a dashboard using the "Process Portfolio Overview " template 2. Go to the Process Page h3. Actual result: 3. Listing the processes fails with this error: h3. Expected result: It should work fine :) h3. Hint: The report template "Are we resolving incidents fast enough?" used in this dashboard is marked as kpiReport although it is a multi-measure report and thus not allowed to be a kpi report. See [https://github.com/camunda/camunda-optimize/blob/master/client/src/components/Home/modals/DashboardTemplateModal.js#L1037] We also need to check the other multi process reports, the one with the key "dashboard.templates.durationSLI" seems likely to cause the same issue as it's a multi process report flagged as kpi Report. |
| Assignee | Original: Sebastian Bathke [ sebastian.bathke ] | New: Andromachi Rozaki [ andromachi.rozaki ] |
| Priority | Original: L3 - Default [ 4 ] | New: L2 - Critical [ 2 ] |
| Description |
Original:
h2. Brief summary of the bug. What is it ? Where is it ?
h2. Steps to reproduce: 1. Create a dashboard using the "Process Portfolio Overview " template 2. Go to the Process Page h3. Actual result: 3. Listing the processes fails with this error: h3. Expected result: It should work fine :) h3. Hint: The report template "Are we resolving incidents fast enough?" used in this dashboard is marked as kpiReport although it is a multi-measure report and thus not allowed to be a kpi report. See [https://github.com/camunda/camunda-optimize/blob/master/client/src/components/Home/modals/DashboardTemplateModal.js#L1037] We also need to check the other multi process reports, the one with the key "dashboard.templates.durationSLI" seems likely to cause the same issue as it's a multi process report flagged as kpi Report. |
New:
h2. Brief summary of the bug. What is it ? Where is it ?
h2. Steps to reproduce: 1. Create a dashboard using the "Process Portfolio Overview " template 2. Go to the Process Page h3. Actual result: 3. Listing the processes fails with an error and no processes listed, see screenshot. h3. Expected result: It should work fine :) h3. Hint: The report template "Are we resolving incidents fast enough?" used in this dashboard is marked as kpiReport although it is a multi-measure report and thus not allowed to be a kpi report. See [https://github.com/camunda/camunda-optimize/blob/master/client/src/components/Home/modals/DashboardTemplateModal.js#L1037] We also need to check the other multi process reports, the one with the key "dashboard.templates.durationSLI" seems likely to cause the same issue as it's a multi process report flagged as kpi Report. |
| Affects Version/s | New: 3.9.0-alpha2 [ 17703 ] |
| Assignee | Original: Andromachi Rozaki [ andromachi.rozaki ] | |
| Resolution | New: Cannot Reproduce [ 5 ] | |
| Status | Original: Open [ 1 ] | New: Done [ 10010 ] |
| Fix Version/s | New: 3.9.0-preview-1 [ 17711 ] |
| Labels | Original: current_release | New: current_release next_release |
| Labels | Original: current_release next_release |