-
Type:
Task
-
Resolution: Fixed
-
Priority:
 L3 - Default
-
Affects Version/s: None
-
Component/s: frontend
-
Not defined
AT:
Carbonise all report type specific configurations
Testing notes:
This changes target report type specific configurations. Here is the list of all of them (every single setting should use carbon components and should work as expected):
- bar chart report
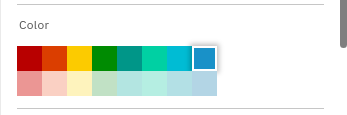
- color picker
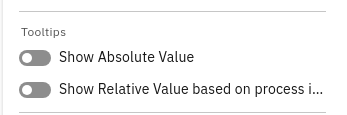
- show relative/absolute values
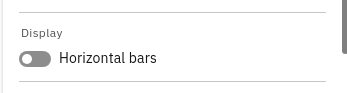
- show horizontal bars
- show stacked bars
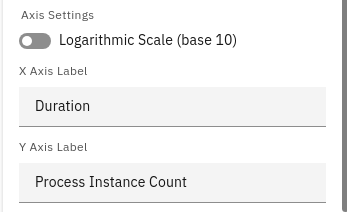
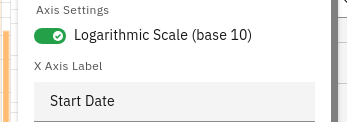
- logarithmic scale toggle
- axis names fields
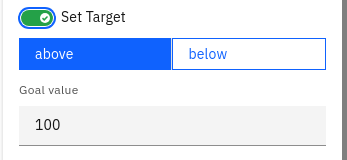
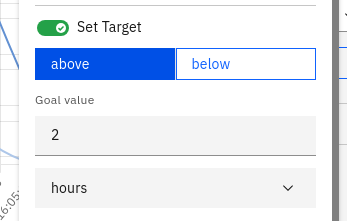
- set target value
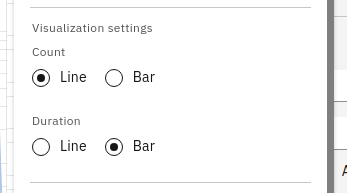
- bar/line chart report
- visualization settings (selecting which data should be line and which should be bars)
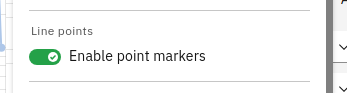
- point markers toggle
- most of the configs from bar chart report
- heatmap report
- show relative/absolute values
- line chart report
- point markers toggle
- most of the bar chart configs
- number report
- set target settings:
- toggle
- target input
- duration input
- display as KPI checkbox
- set target settings:
- pie chart report
- show relative/absolute values
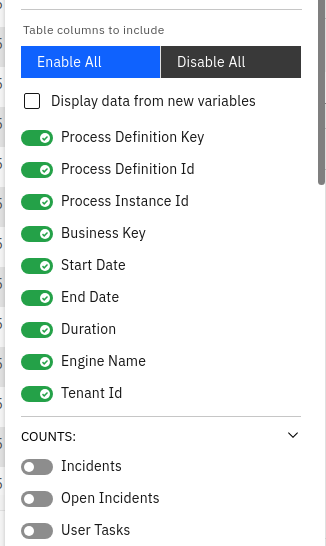
- table report
- show relative/absolute values
- gradient bars toggle
This is the controller panel for Smart Panels app
- depends on
-
-
- Done
-