-
Type:
Task
-
Resolution: Fixed
-
Priority:
 L3 - Default
-
Affects Version/s: None
-
Component/s: frontend
-
None
AT:
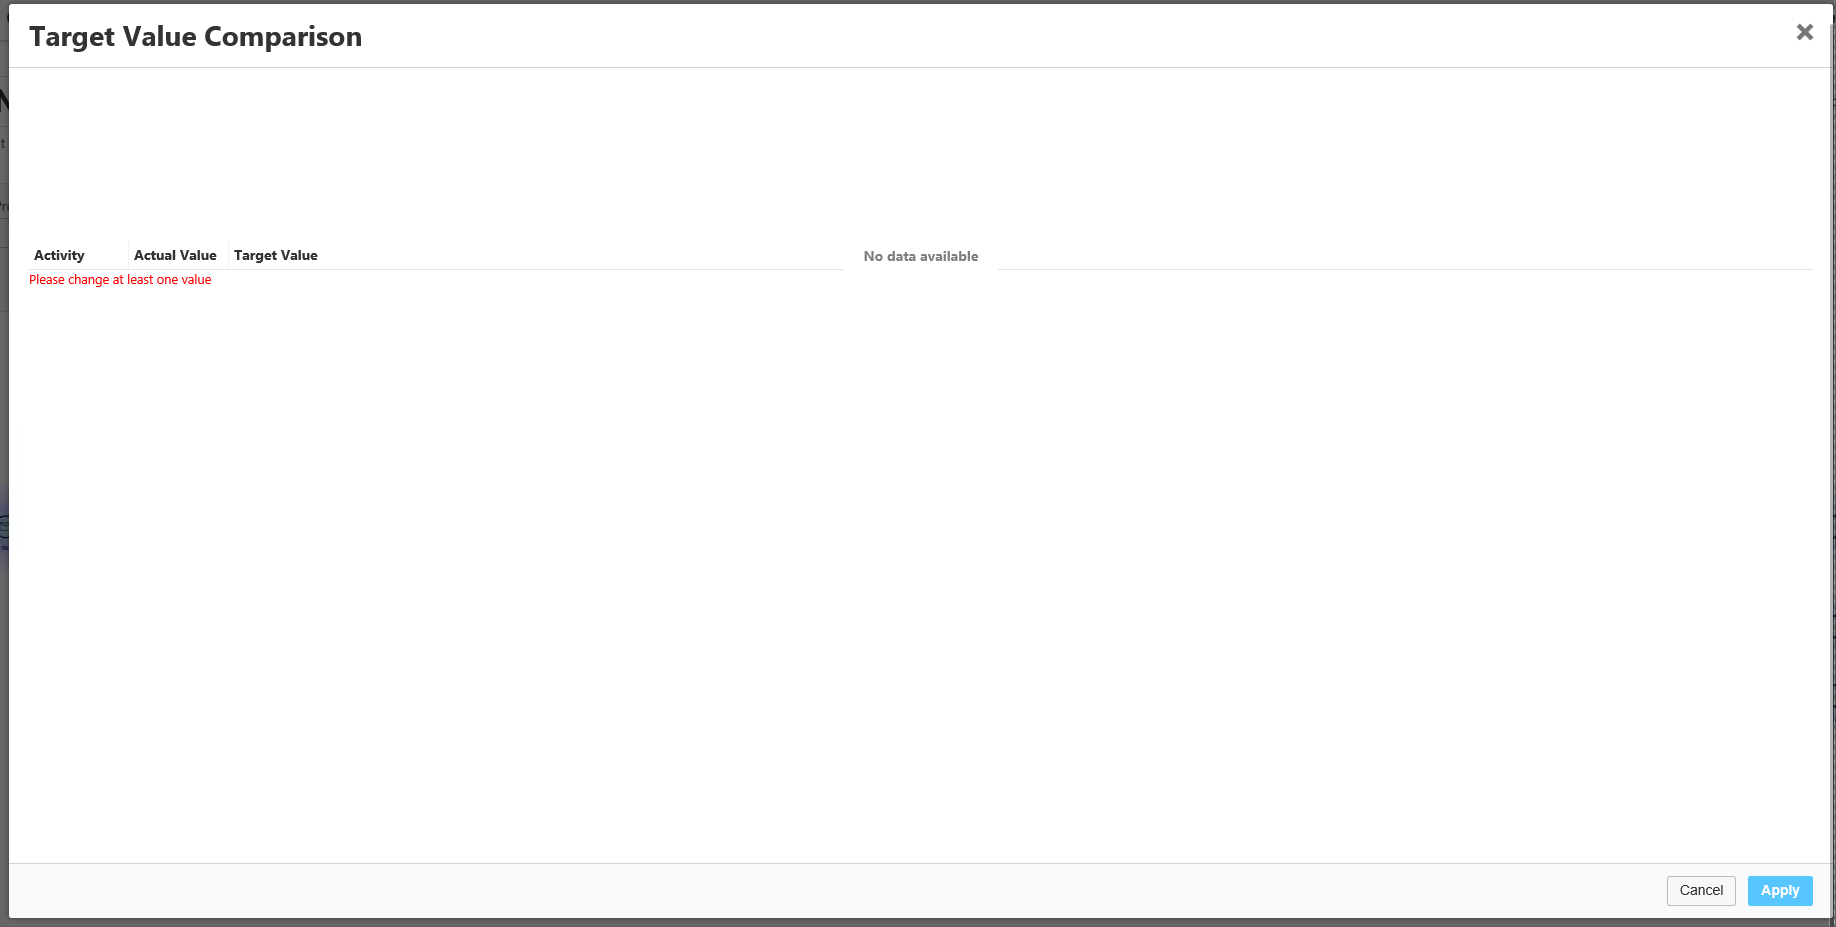
- I go the target value comparison in the report builder (choose view: average flow node duration, group by: flow nodes, visualize as: heatmap and click on target): while the data is loaded to be rendered as a table, I see a loading indicator
Context:
- When the process diagram is quite large, it can take quite some time to load the data and render the table. During that loading time the following image is displayed:
 . It is not transparent to the user that the modal is still loading, but the user has rather the feeling that there is a bug. We should therefore show a loading indicator instead, while the data is loading.