-
Type:
Feature Request
-
Resolution: Unresolved
-
Priority:
 L3 - Default
-
None
-
Affects Version/s: None
-
Component/s: None
-
4
-
Not defined
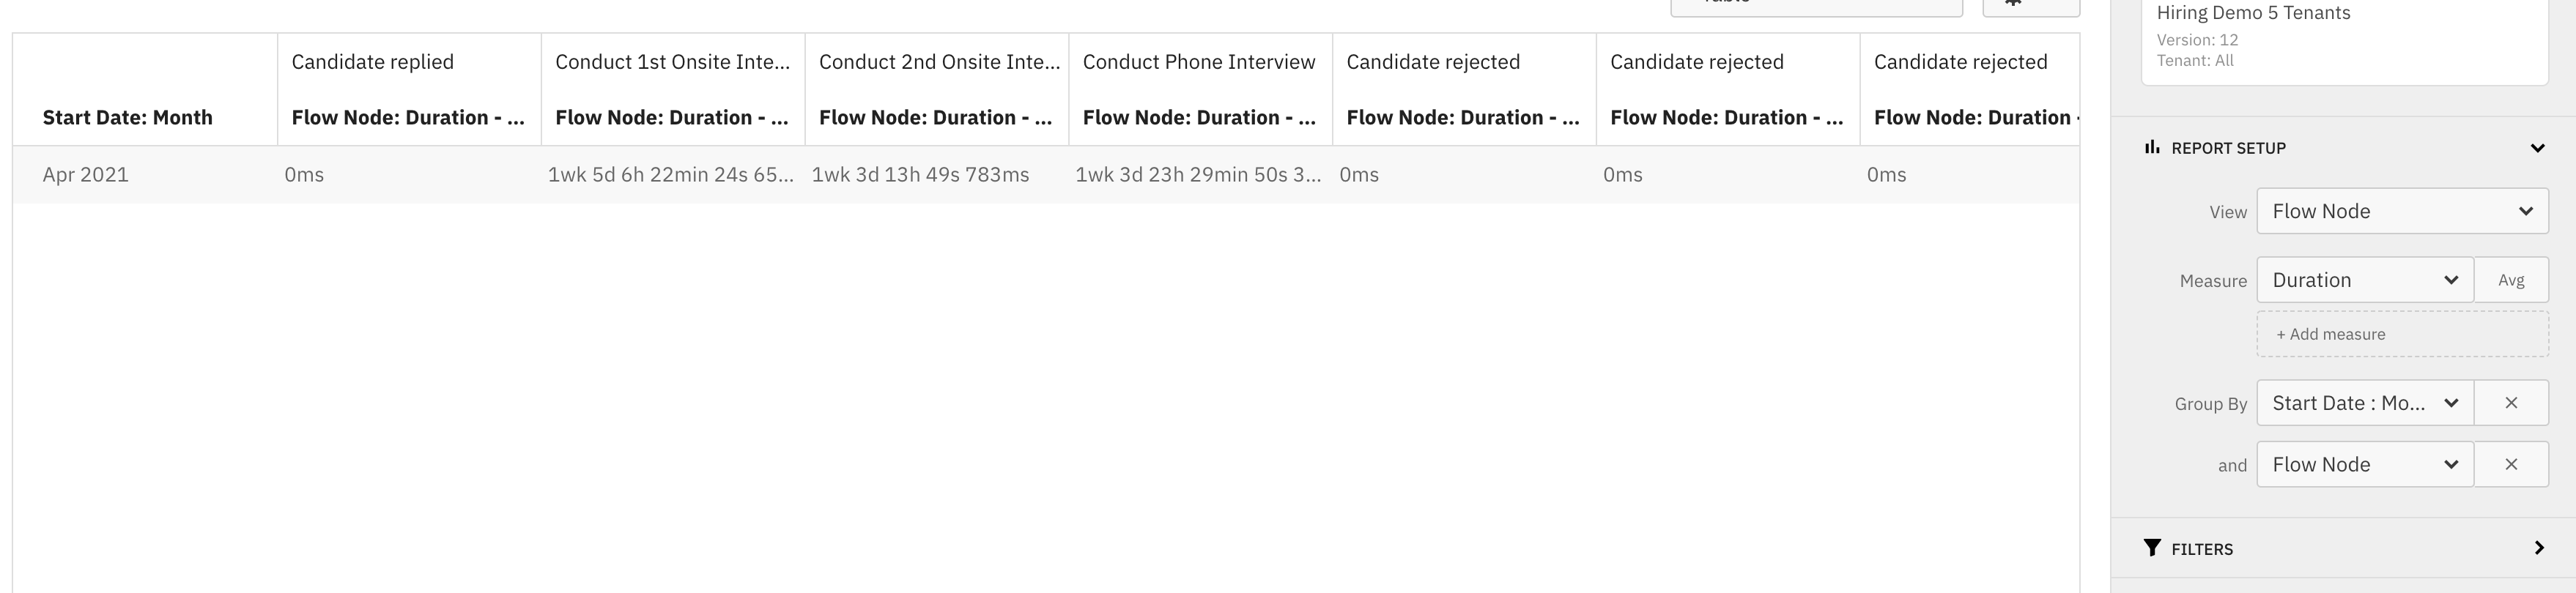
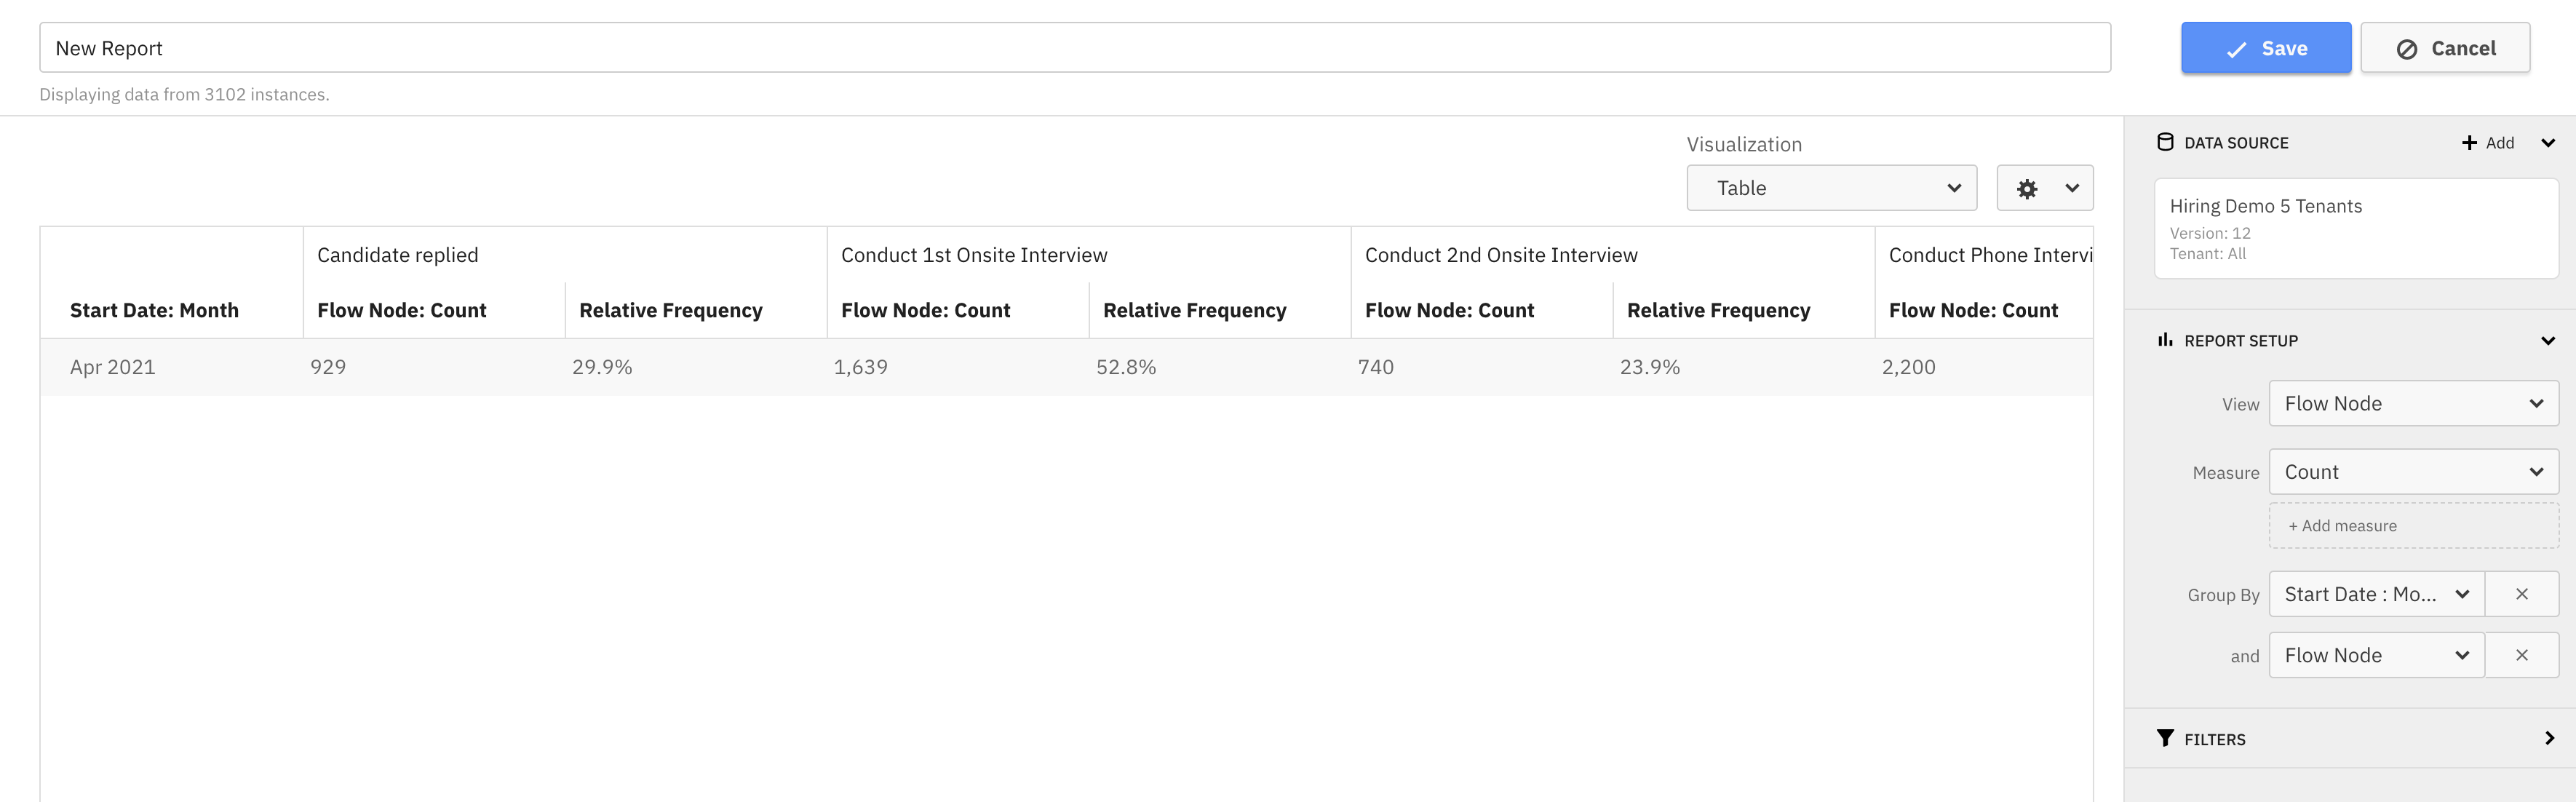
For all flow node duration report views (min, median, average, max), the relative share of every flow nodes duration is displayed in table, charts and heatmap views. It is displayed similarly to how the relative value is displayed in count views.
This answers questions like:
"Where in the most of the time being spent?"
- Note: This can also be answered visually through the heatmap
For this feature, the backend needs to either explicitely send the relative share for every flow node, or send the comparison value for the process instance in order for the frontend to calculate the relative value (similar to how the backend sends the total number of process instances in the filter for the count views).

- is related to
-
-
- Done
-