-
Type:
Task
-
Resolution: Done
-
Priority:
 L3 - Default
-
Affects Version/s: None
-
Component/s: None
-
None
Here is the text, feel free to change anything:
Optimize also allows you to set a goal line in Barchart view. Using this feature, it is possible to highlight anything above or below a certain value.
A good use case for such functionality is the following example:
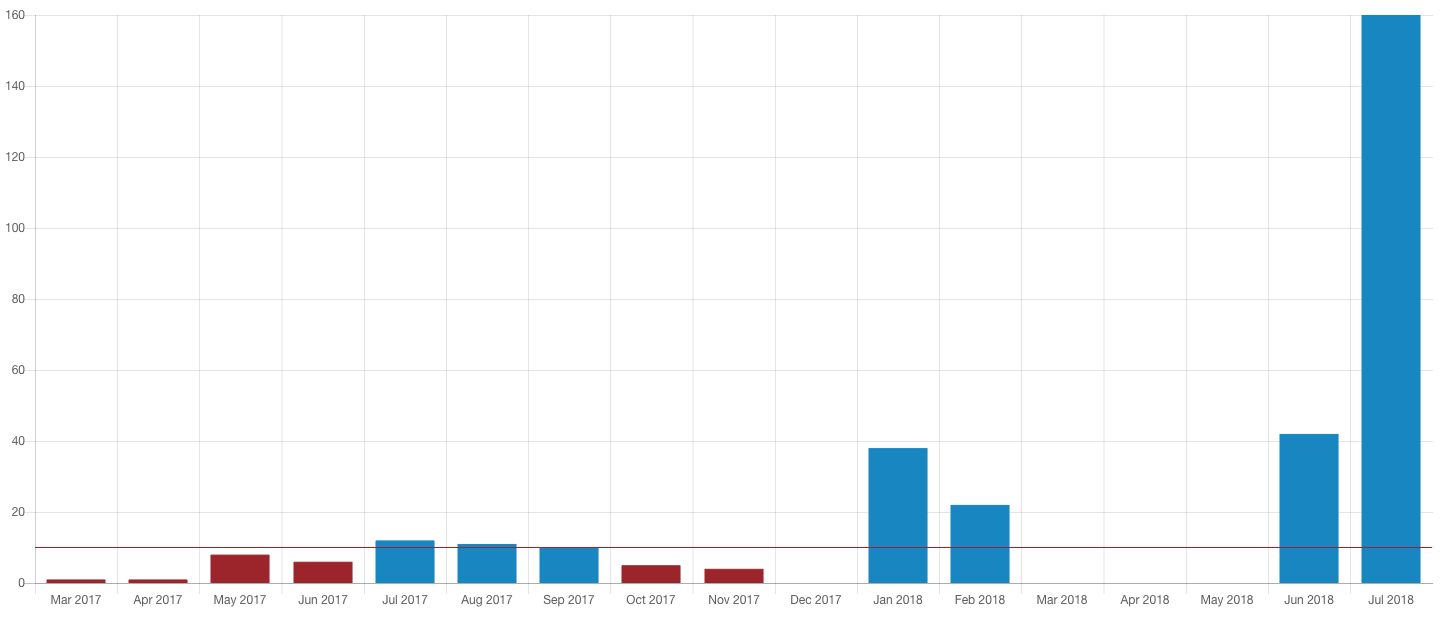
Let us say that the number of completed process instances every month should always be above 10 instances. A goal line can be used to visualize that:
First, go to the edit mode of a report and choose the following configuration:
Table:
View Count Frequency of Process Instance
Group by Start Date of Process Instances - month
Visualize as Barchart
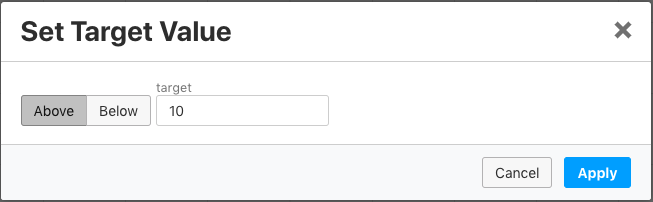
Now click on the Target value button in the bar chart view to see the following:

Set the target value input field to 10 and select the above button. Now if the number of process instances is below 10 in any month, that month will be highlighted in red as shown.

This feature can be also used in other places where the bar chart visualization is possible.