Uploaded image for project: 'Camunda Optimize'
  1. Camunda Optimize
  2. OPT-2171

Enabled Goal Line in Instance Count View hides Line chart

    XMLWordPrintable

Details

    • Bug Report
    • Resolution: Fixed
    • L3 - Default
    • 2.5.0-alpha1, 2.5.0
    • None
    • frontend
    • None

    Description

      • given:
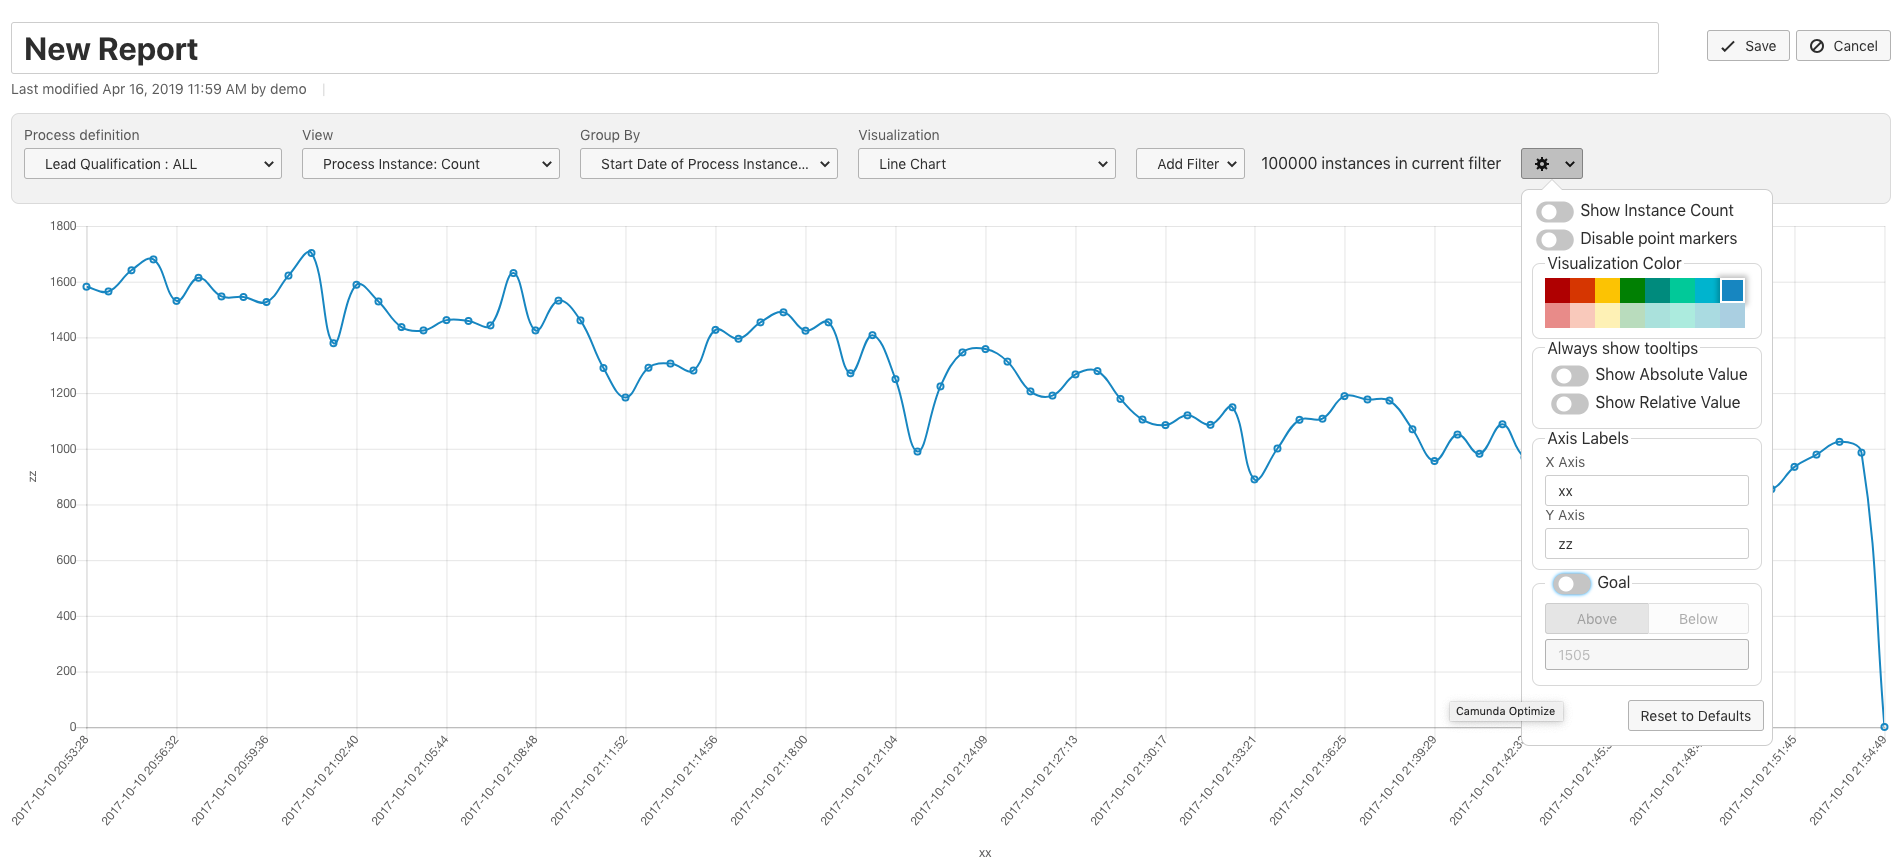
        • Engine and Optimize are up, configured and running
        • I am creating a report and I am in the report edit mode
        • I select a process definition and Process Instance:Count View, group by start date automatic
        • I visualize as Line Chart
      • when:
        • I activate the goal line in configuration options
      • then:
        • I only see the goal line, not the line chart
      • expected:
        • I should see both lines

      mgm-controller-panel

        This is the controller panel for Smart Panels app

        Attachments

          Activity

            People

              Unassigned Unassigned
              felix.mueller Felix Mueller
              Votes:
              0 Vote for this issue
              Watchers:
              2 Start watching this issue

              Dates

                Created:
                Updated:
                Resolved:

                Salesforce