Uploaded image for project: 'Camunda Optimize'
  1. Camunda Optimize
  2. OPT-2365

Combined report (group by start/end dates) as bar chart wrong sequence of dates

    XMLWordPrintable

Details

    • Bug Report
    • Resolution: Fixed
    • L3 - Default
    • 2.7.0
    • None
    • frontend
    • None

    Description

      Given:
      1. Create two reports, process instance count grouped by start/end date and one other grouped by start/end date
      2. group by a fixed unit, e.g. month
      3. set filters on both so that they have no overlapping time periods

      When:
      I combine them in a combined report

      Then:
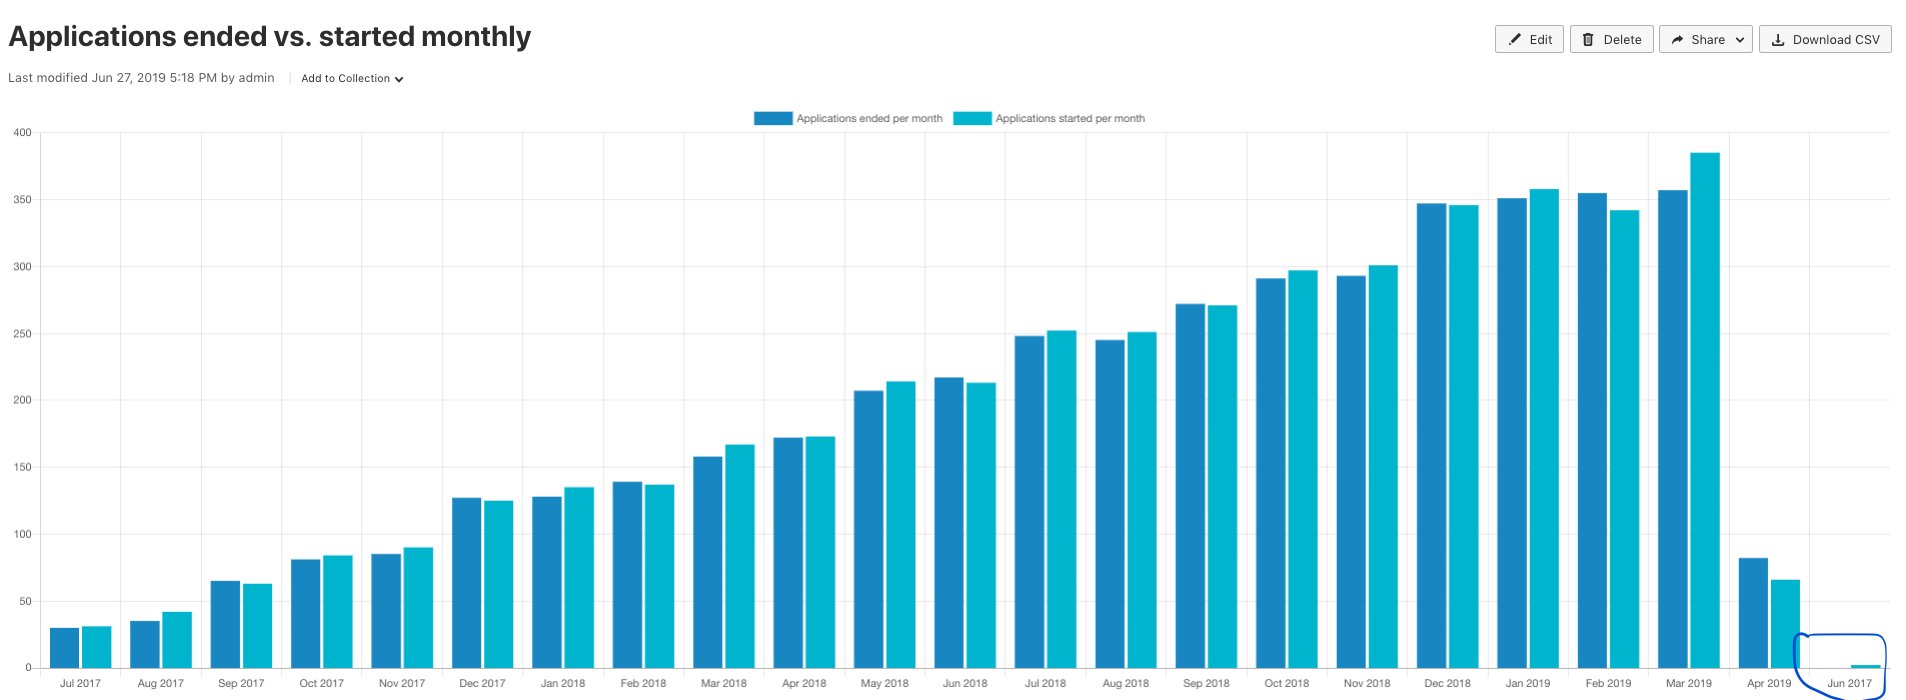
      Depending on their order the time sequence is not correct on the x-axis

      Expected:
      Time sequence on x-axis should be correct no matter the order of the reports
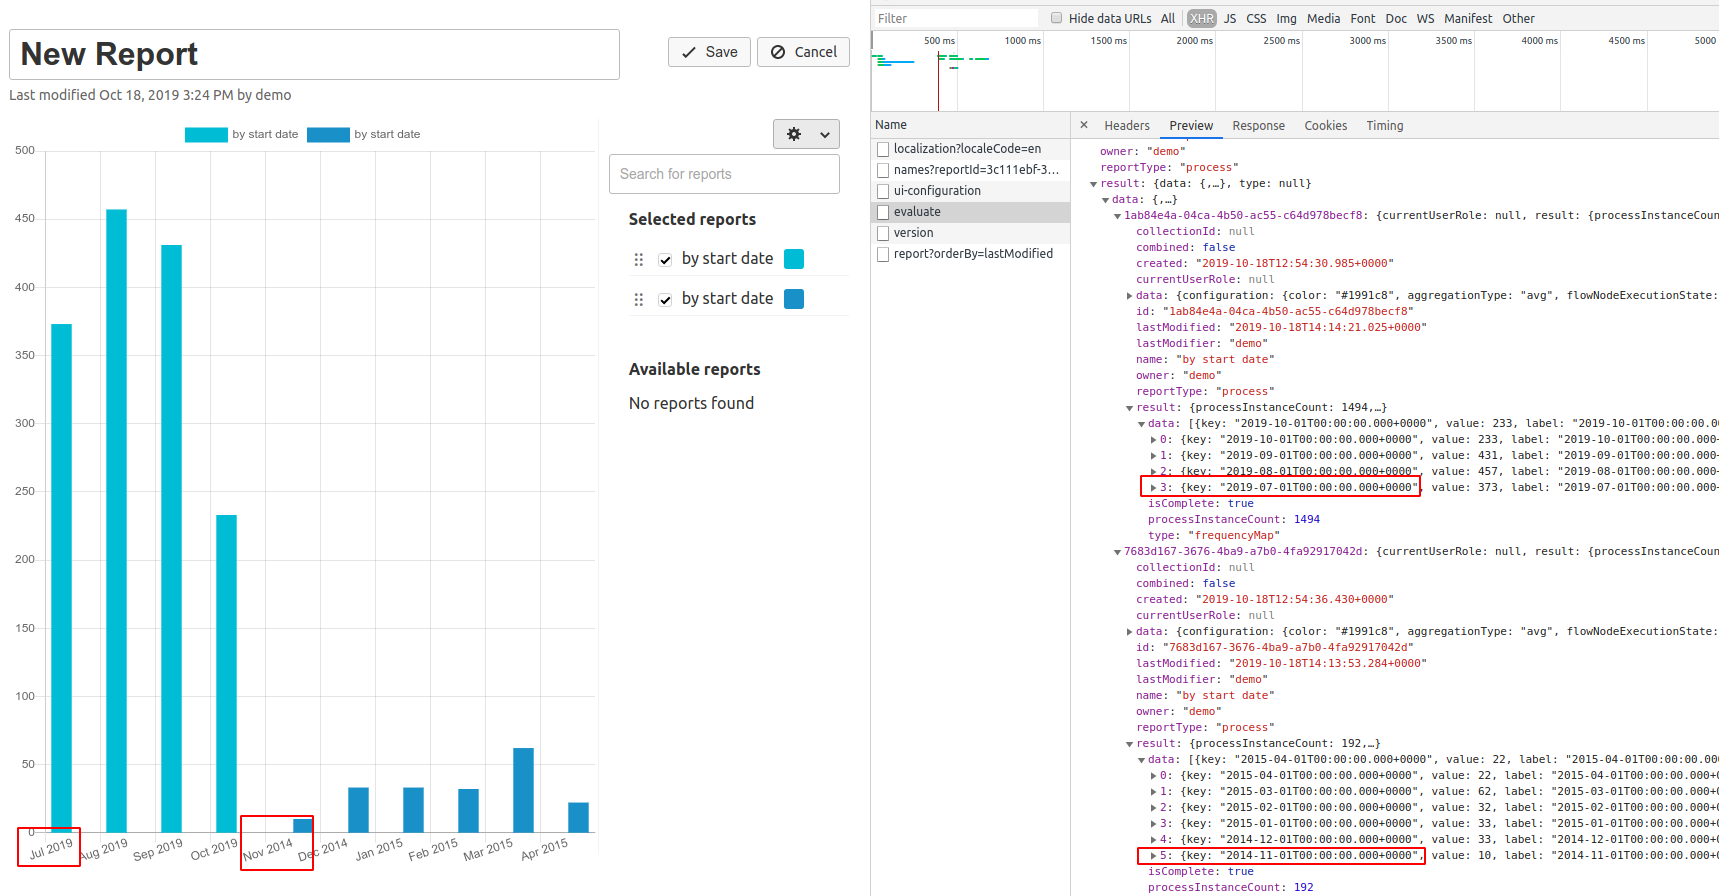
      Hint:
      See the latest screenshot added for details on the actual report results (non-overlapping date buckets). Based on their order in the report selection the graph was sometimes correct sometimes not.

      mgm-controller-panel

        This is the controller panel for Smart Panels app

        Attachments

          Activity

            People

              Unassigned Unassigned
              felix.mueller Felix Mueller
              Votes:
              0 Vote for this issue
              Watchers:
              2 Start watching this issue

              Dates

                Created:
                Updated:
                Resolved:

                Salesforce