Uploaded image for project: 'Camunda Optimize'
  1. Camunda Optimize
  2. OPT-2394

Raw Data Table as Chart (single instance in charts)

    XMLWordPrintable

Details

    • Feature Request
    • Resolution: Unresolved
    • L3 - Default
    • None
    • None
    • None
    • 3
    • Not defined

    Description

      When looking at durations of process instances it might be interesting to look at single instance duration grouped by start date. This can help identifying issues with single instances in a certain period of time.

      Hint:
      Consider a Gantt chart plugin to show the duration.
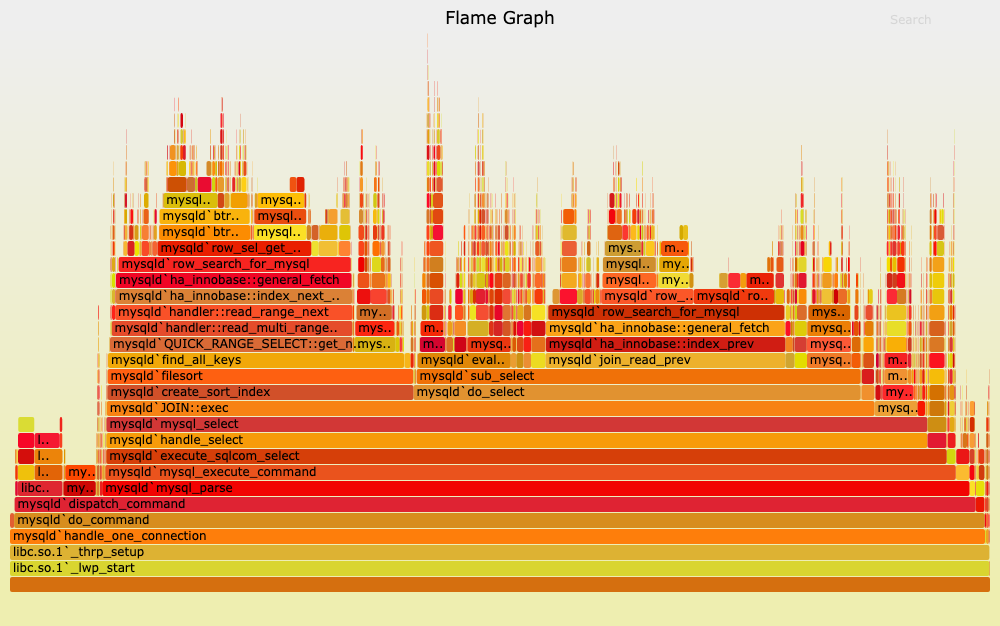
      Software analysis tools use 'flame graphs' to track service calls during an execution path.
      We can borrow inspiration from either

      mgm-controller-panel

        This is the controller panel for Smart Panels app

        Attachments

          Activity

            People

              Unassigned Unassigned
              felix.mueller Felix Mueller
              Votes:
              0 Vote for this issue
              Watchers:
              2 Start watching this issue

              Dates

                Created:
                Updated:

                Salesforce