-
Type:
Feature Request
-
Resolution: Unresolved
-
Priority:
 L3 - Default
-
None
-
Affects Version/s: None
-
Component/s: None
-
3
-
Not defined
What is the desired functionality that you are missing?
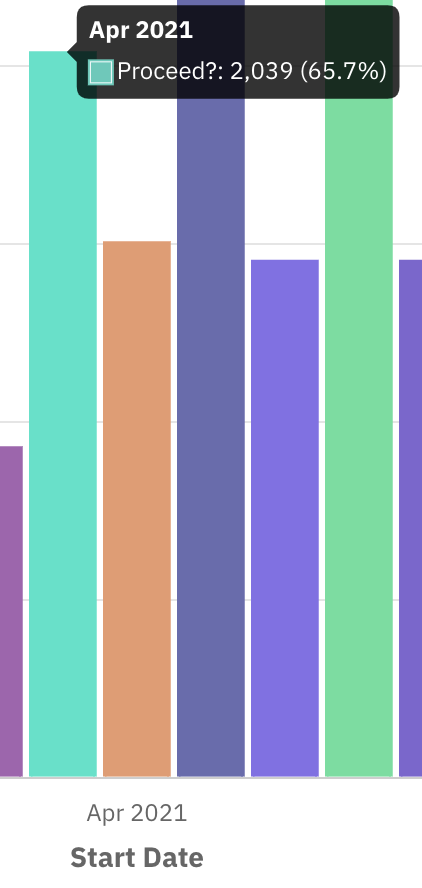
When looking at avg duration of process instance visualized as charts I would like to be able to drill down to a view that shows the information on an instance level.
Additionally I would like to be able to find out which instance this is so that I can eventually display more details about this.
Which problem are you going to solve with this functionality?
This functionality helps me to manually find and analyse instances that went mad / have very long durations.
Hint:
Consider Jira dashboard drilldown (everything is clickable)
Consider clicking to see a raw data report with the desired filter (see example below)