Uploaded image for project: 'Camunda Optimize'
  1. Camunda Optimize
  2. OPT-3856

Wrong scaling of horizontal axis when Group By Start Date Automatic

    XMLWordPrintable

Details

    • Bug Report
    • Resolution: Won't Fix
    • L3 - Default
    • 3.1.0
    • None
    • None
    • None
    • Not defined

    Description

      Given
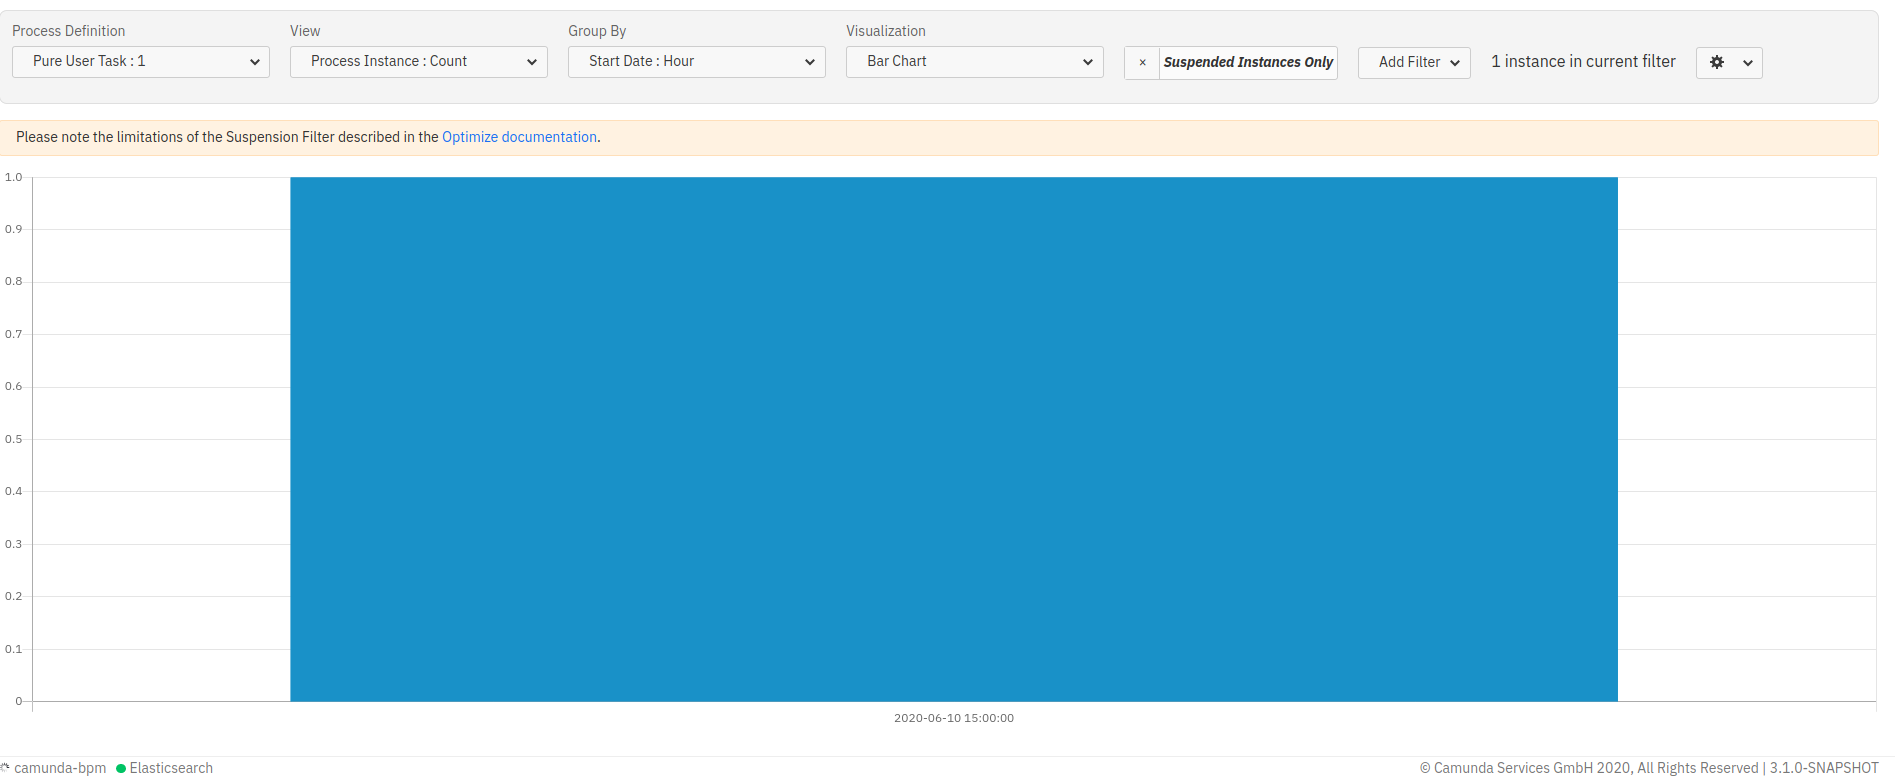
      One instance (started 2020-06-10 14:00:00) in a bar chart report grouped by start date:hour

      When
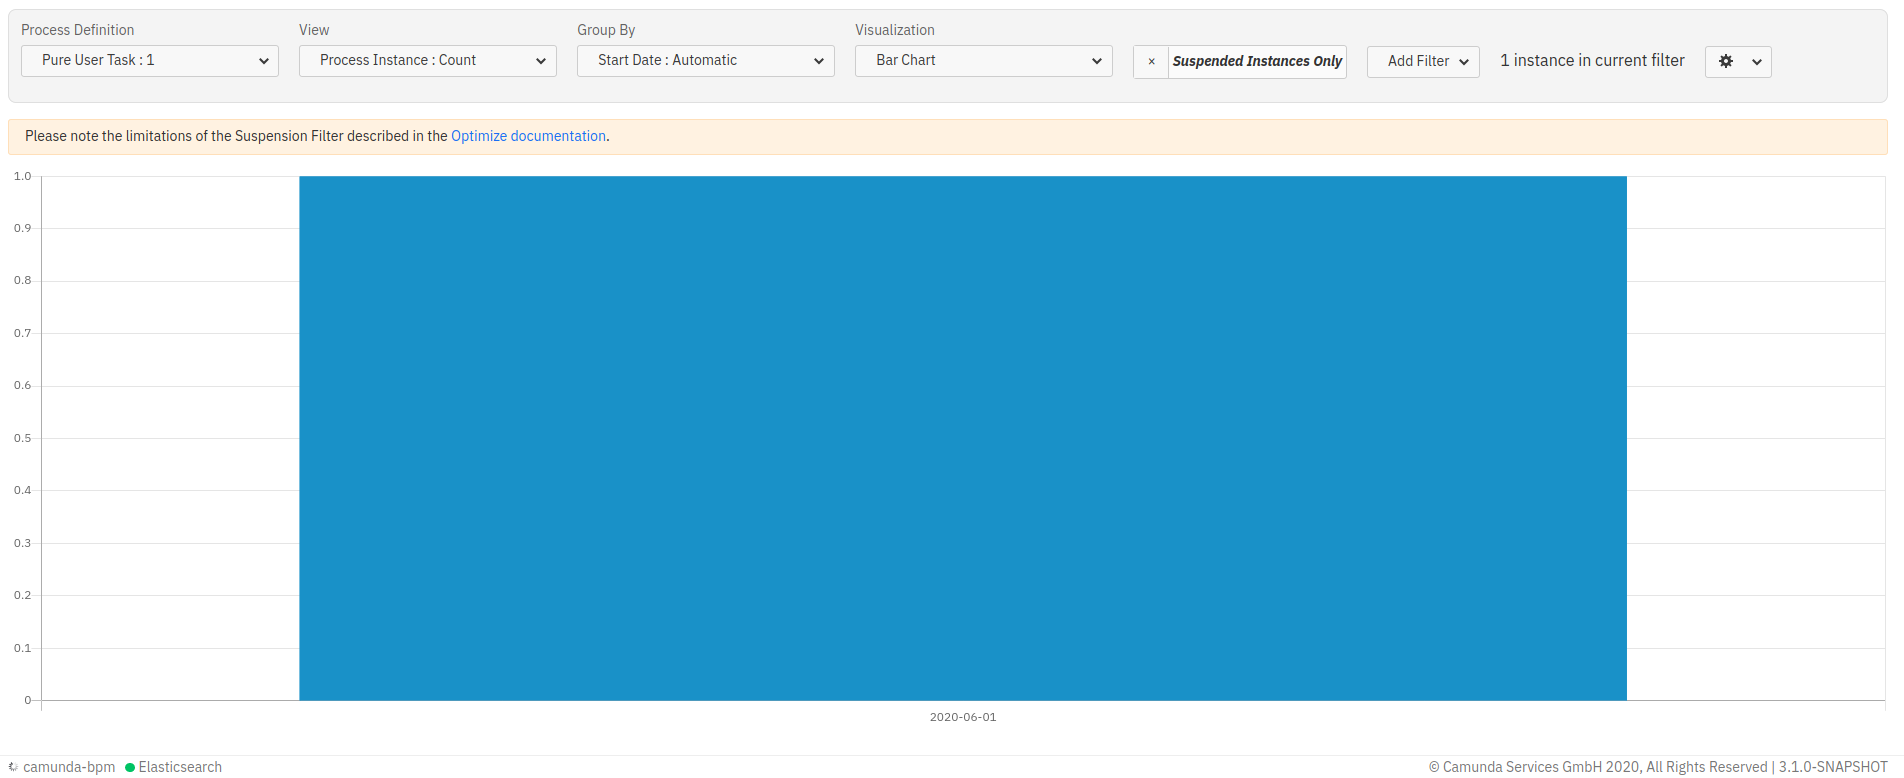
      I switch the to Group By Start Date: Automatic

      Then
      The timestamp visualized in the x-axis is 2020-06-01

      Problem
      The timestamp is wrong

      mgm-controller-panel

        This is the controller panel for Smart Panels app

        Attachments

          Activity

            People

              Unassigned Unassigned
              michael.schoettes Michael Schoettes
              Votes:
              0 Vote for this issue
              Watchers:
              2 Start watching this issue

              Dates

                Created:
                Updated:
                Resolved:

                Salesforce