-
Feature Request
-
Resolution: Fixed
-
 L3 - Default
-
None
-
None
-
Not defined
What is the desired functionality that you are missing?
In situations where I have
a) double grouping active in a process report (group by + distributed by) or
b) using a combined report with double grouping
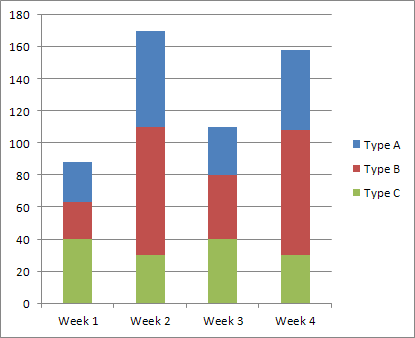
I would like to be able to choose stacked bars as a visualization. Currently the bars can only be displayed next to each other, but in certain scenarios it makes sense to visualize the bars stacked.
An example

Which problem are you going to solve with this functionality?
**The new or modified visualization would help me to get a quicker overview about the results and also show me the total number for one "bucket" which can be relevant in certain scenarios.
This is the controller panel for Smart Panels app
1.
|
Move stacked bar visualization into a configuration option |
|
Done | Unassigned |
2.
|
Add stacked groups visualization for multi measure multi groupby reports |
|
Done | Unassigned |
3.
|
add stacked bar chart visualization option when having a second group by |
|
Done | Unassigned |
4.
|
Migrate old reports to have the new stackedBar property |
|
Done | Unassigned |
[OPT-3876] Allow users to modify bar chart visualization to stacked bar
| Link | New: This issue is depended on by SUPPORT-7944 [ SUPPORT-7944 ] |
| Description |
Original:
What are the steps to reproduce your problem?
What is the problem? What would be the expected behavior: Hints (optional): |
New:
|
| Mentioned Roles |
| Mentioned Groups |
| Description |
Original:
|
New:
*What is the desired functionality that you are missing?*
In situations where I have a) double grouping active in a process report (group by + distributed by) or b) using a combined report with double grouping I would like to be able to choose stacked bars as a visualization. Currently the bars can only be displayed next to each other, but in certain scenarios it makes sense to visualize the bars stacked. *Which problem are you going to solve with this functionality?* **The new or modified visualization would help me to get a quicker overview about the results and also show me the total number for one "bucket" which can be relevant in certain scenarios. |
| Mentioned Roles |
| Mentioned Groups |
| Attachment | New: stacked-bars-sample.png [ 34646 ] |
| Description |
Original:
*What is the desired functionality that you are missing?*
In situations where I have a) double grouping active in a process report (group by + distributed by) or b) using a combined report with double grouping I would like to be able to choose stacked bars as a visualization. Currently the bars can only be displayed next to each other, but in certain scenarios it makes sense to visualize the bars stacked. *Which problem are you going to solve with this functionality?* **The new or modified visualization would help me to get a quicker overview about the results and also show me the total number for one "bucket" which can be relevant in certain scenarios. |
New:
*What is the desired functionality that you are missing?*
In situations where I have a) double grouping active in a process report (group by + distributed by) or b) using a combined report with double grouping I would like to be able to choose stacked bars as a visualization. Currently the bars can only be displayed next to each other, but in certain scenarios it makes sense to visualize the bars stacked. An example !stacked-bars-sample.png|thumbnail! *Which problem are you going to solve with this functionality?* **The new or modified visualization would help me to get a quicker overview about the results and also show me the total number for one "bucket" which can be relevant in certain scenarios. |
| Mentioned Roles |
| Mentioned Groups |