-
Type:
Feature Request
-
Resolution: Fixed
-
Priority:
 L3 - Default
-
Affects Version/s: None
-
Component/s: None
-
Not defined
What is the desired functionality that you are missing?
In situations where I have
a) double grouping active in a process report (group by + distributed by) or
b) using a combined report with double grouping
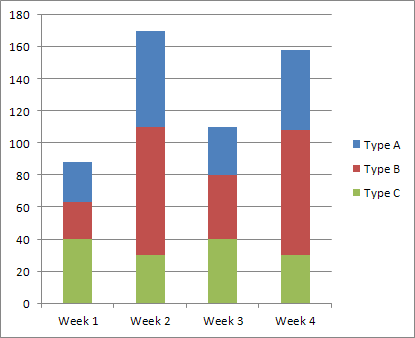
I would like to be able to choose stacked bars as a visualization. Currently the bars can only be displayed next to each other, but in certain scenarios it makes sense to visualize the bars stacked.
An example

Which problem are you going to solve with this functionality?
**The new or modified visualization would help me to get a quicker overview about the results and also show me the total number for one "bucket" which can be relevant in certain scenarios.
- is related to
-
OPT-4991 Q3 - Multiple viz, Stacked bars
-
- Done
-
There are no Sub-Tasks for this issue.