-
Type:
Design Task
-
Resolution: Done
-
Priority:
L3 - Default
-
Affects Version/s: None
-
Component/s: None
-
None
-
Not defined
Use Case driven dashboards
--------------------------
Doing
• Allow creation of dashboards via template from the Homepage
• Allow creation of dashboards via template from Collection
-data source must be added first
• Improve usability of create modal
• Allow editing of Reports from the Dashboard
Not Doing
• Editing Data source
- Proposed for second iteration
• No improvements of copy or move functionality
- Requires permission concept re-think
• No improvements in the list display of entities
Prototype video
1) Create via modal
2) Edit mode of Dashboard *
3) Edit report icon
4) Unsaved Dashboard modal
5) Saved Dashboard - view report link (current behaviour)
https://drive.google.com/file/d/19sIHR4CHS32vVxUly-qW-_V7kDXfjqny/view?usp=sharing
Some design may vary from video- see zeplin link
- Dashboard edit mode
******Current behaviour: Entity that is created by template is not saved until user explicitly does this.
Dashboards created via template: edit mode contains entities themselves are created but not saved.
Is it possible to have multiple entities in an edit mode?
Solution: Modal to save before actions relating to report data can be undertaken
Actions that show save and continue modal:
• Add filter
• Edit Report
Actions that DO NOT show save modal:
anything that pertains to display
• Resize
• Moving reports on the dashboard
• Remove report
• Rename Dashboard
Report layouts
---------
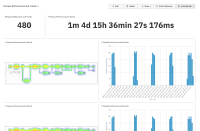
Number report-Count: 2 x 4
Number report-Duration: 2 x 14
Heatmap 5 x 9
Barchart 5x9
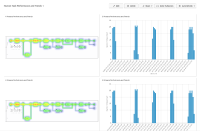
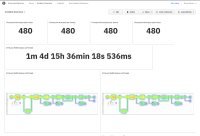
Example screenshots added with place holder reports
Templates
---------
+sensible layout and order in the view
1. Process Performance and Trends
• Total Number of instances
• Process duration (Avg)
• Bar chart: Instance count by start date (Name: Instance trends)
• Bar Chart: Instance duration by start date (Name: Instance Duration trends)
• Heatmap: Flow node count grouped by flow nodes (Name Report: Flownode frequency)
• Heatmap: Flow node Duration Grouped by flow nodes ( Name Report : Flownode duration)
2.Human Task Performance and Trends
• Heatmap: Flow node Duration Grouped by flow nodes ( Name Report : Idle time)
• Heatmap: Flow node Duration Grouped by flow nodes ( Name Report : Work time)
• Barchart: User task Count grouped by start date:Month Distributed by Assignee ( Name Report : Tasks started per month)
• Barchart: User task Count grouped by end date:Month Distributed by Assignee ( Name Report : Tasks completed per month)
3. Incident Overview
• Number: Instance count grouped by none (Name:Total instances)
• Number: Instance count grouped by none filtered with open incidents (Name: Instances with Incidents)
• Number: Open Incident count grouped by none ( Name Report : Open incidents )
• Number: Resolved Incident count grouped by none ( Name Report : Resolved incidents )
• Number: Incident Resolution duration grouped by none ( Name Report : Resolution duration AVG)
• Heatmap: Open Incident count grouped by flow node (Name report: Steps with Open Incidents)
• Heatmap: Resolved Incident count grouped by flow node (Name report: Steps with Resolved Incidents)
• Heatmap: Incident Resolution Durations grouped by flow node (Name report: Resolution durations )
TASK: Create via template modal improvements (Reports and Dashboards)
---------------
• Create dashboard displays modal with template options
• Focus on Process Definition selection
• Amend Name field label 'Report name' 'Dashboard name' (no add)
• Selected state of template design update
• If name not explicitly added - entity takes name of the template
• Template option design update
TASK: Report thumbnail
--------------
Edit mode:
• Add edit icon - edit icon drops user directly in edit mode
• Change close icon
TASK: Report display
-----------------
• Set widths that make sense for the visualised data {asia}
• Number reports displayed responsively (seperate tiket)
TASK: Button group improvement
---------
• Separate the entity control buttons from the action buttons
• Save is the primary button
Links:
Zeplin - > https://app.zeplin.io/project/5b4f294ab0d5cf0c2c391d1d/dashboard?seid=5ec4e5ebbf5b3047f0f0379f
Video - > https://drive.google.com/file/d/19sIHR4CHS32vVxUly-qW-_V7kDXfjqny/view?usp=sharing
- is related to
-
OPT-3804 Use-Case driven Dashboard Templates
-
- Done
-


