-
Type:
Feature Request
-
Resolution: Unresolved
-
Priority:
 L3 - Default
-
None
-
Affects Version/s: None
-
Component/s: None
-
3
-
Not defined
What is the desired functionality that you are missing?
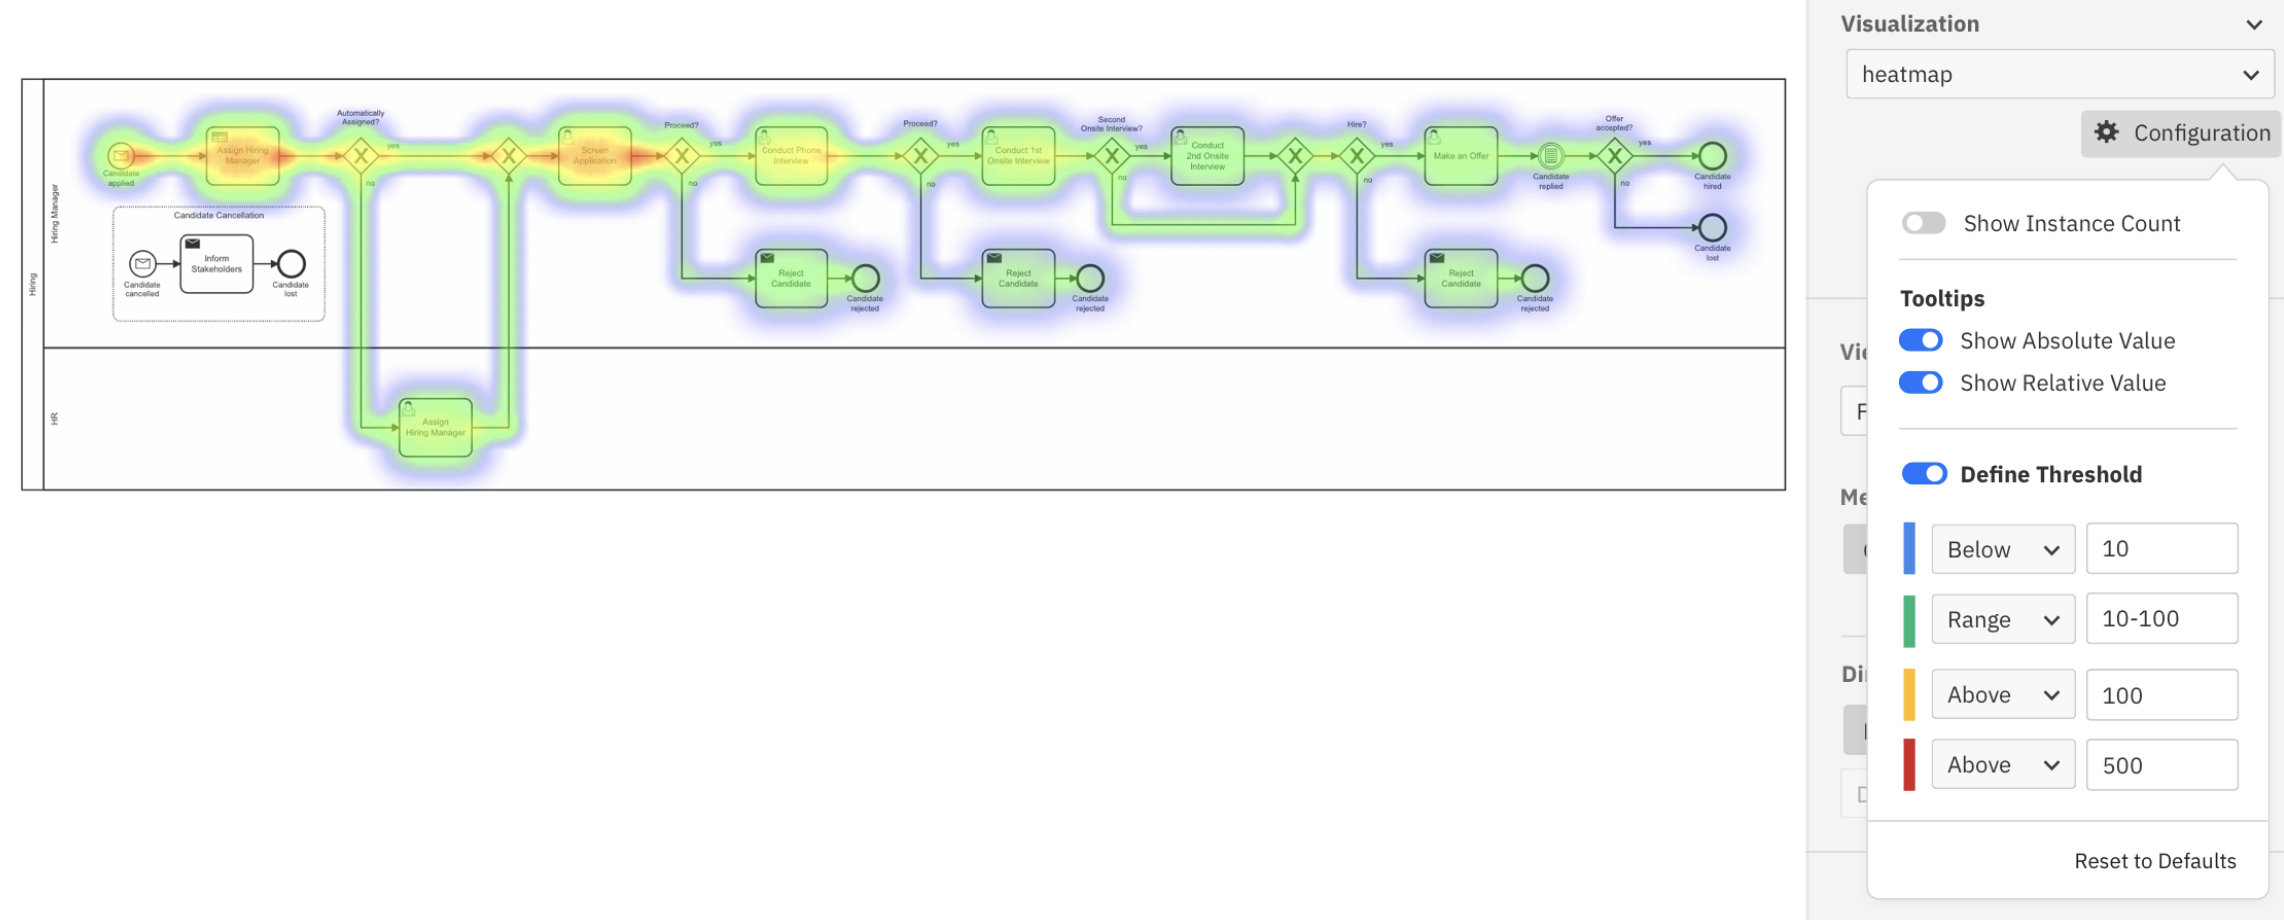
As a user, I would like to be able to customize the heatmap colors based on a couple of threshold values.
The threshold value is 10 for a service task so blue color, if it crosses the value 100 then change it yellow and subsequently some other color.
The same functionality could be interesting for duration thresholds too.
Which problem are you going to solve with this functionality?
As a user I need to get a quick overview of performance and defining thresholds helps me to identify which tasks need my special attention. By using specific colors this makes it a lot easier.
Context:
The attached screenshot shows how the configuration of the threshold values could look like. Heatmap visualization would need to be replaced by coloured flow nodes in that case.
- is related to
-
-
- Open
-
- links to