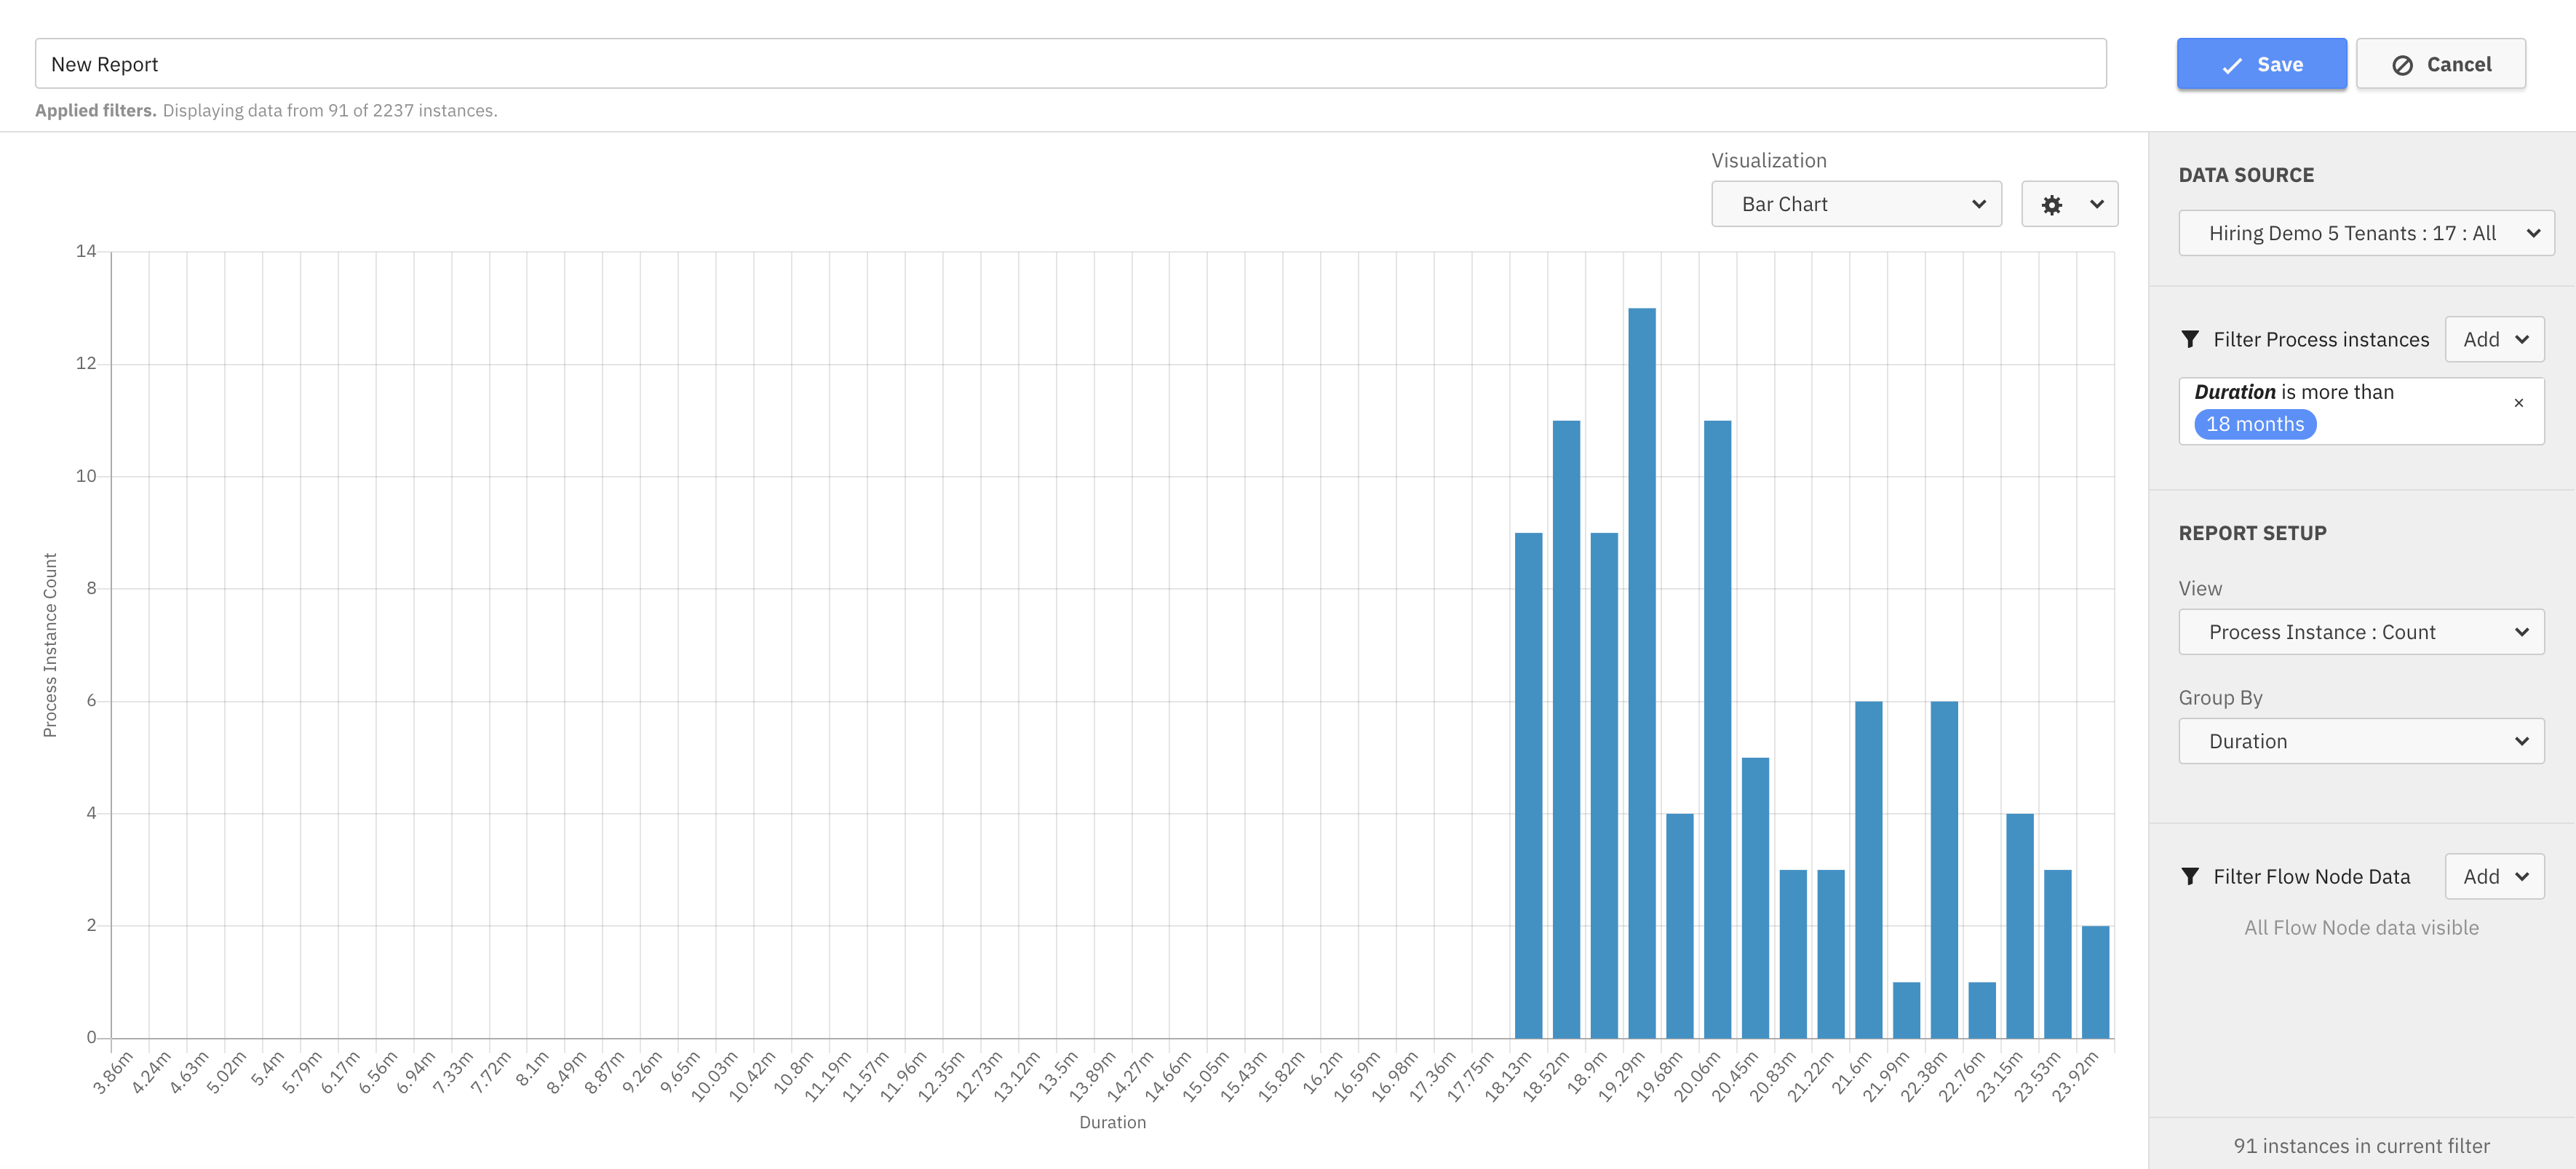
When I group Process Instance Count by Duration and visualize as Bar Chart
and then filter for "Process Instance Duration" > x months
the X-axis starts with durations way before this - even though there can't be any data?
See also

When I group Process Instance Count by Duration and visualize as Bar Chart
and then filter for "Process Instance Duration" > x months
the X-axis starts with durations way before this - even though there can't be any data?
See also