-
Type:
Bug Report
-
Resolution: Unresolved
-
Priority:
 L3 - Default
-
None
-
Affects Version/s: None
-
Component/s: frontend
-
3
-
Not defined
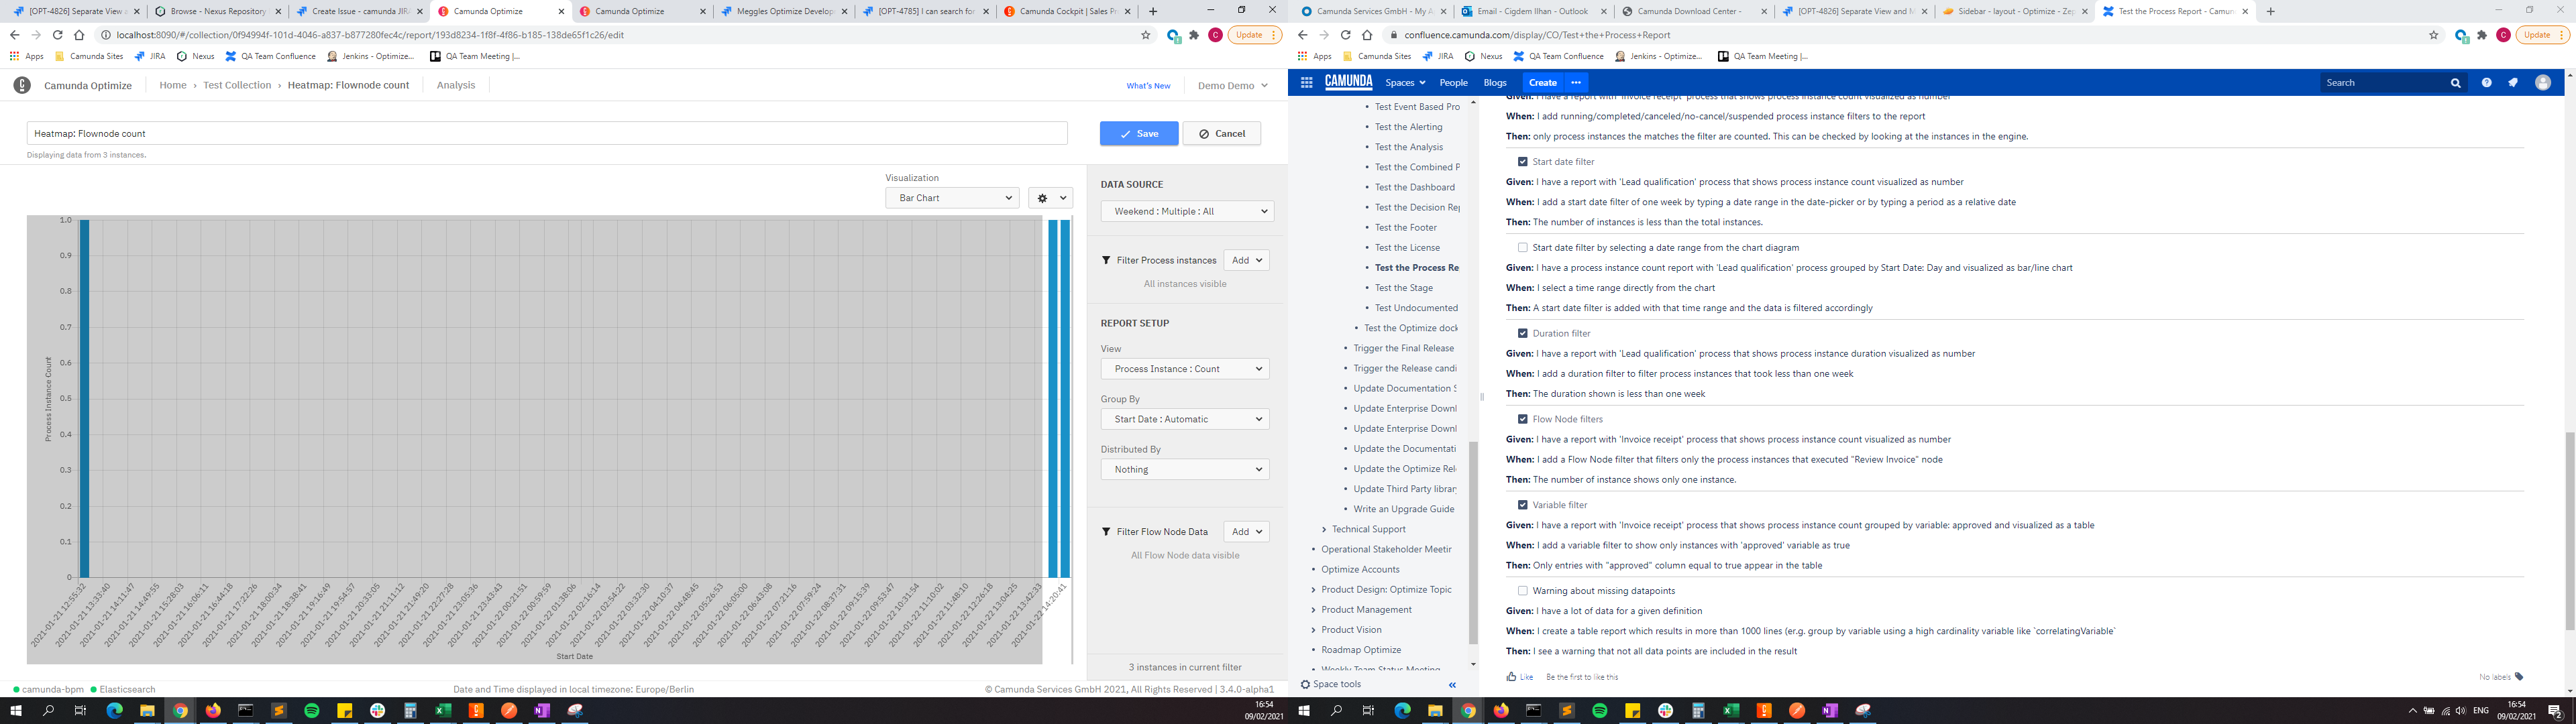
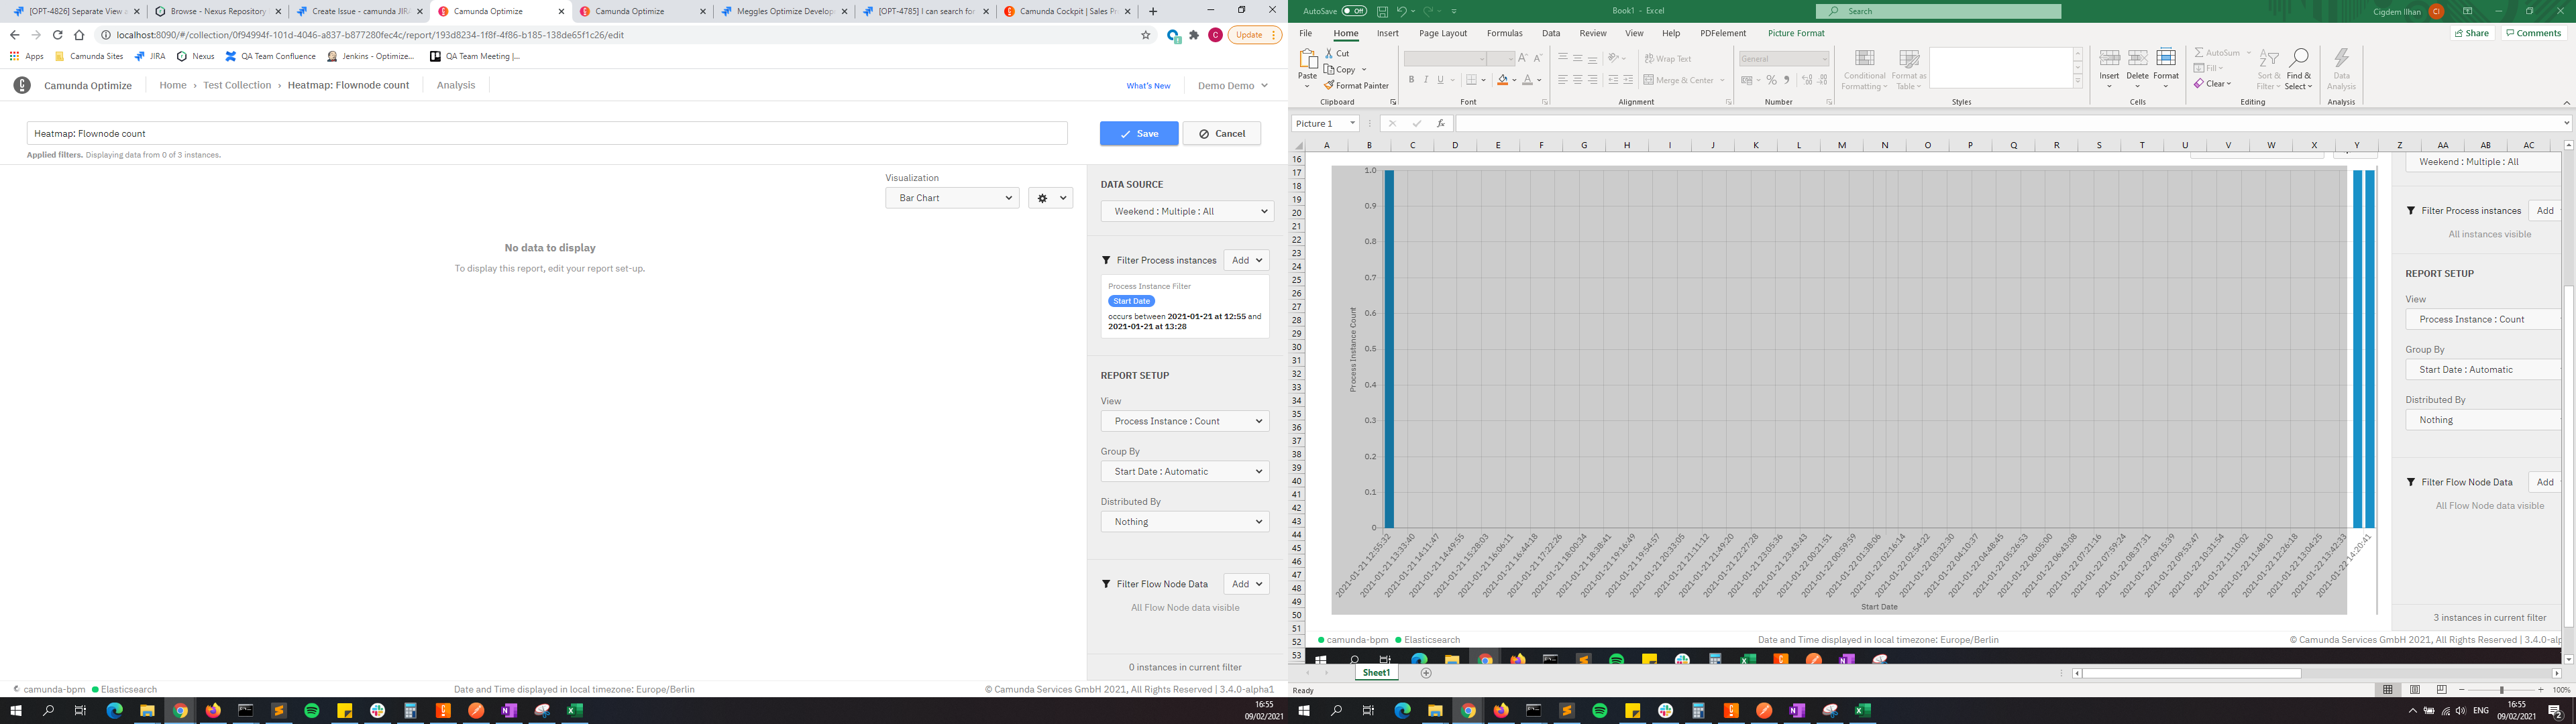
Problem: When I select the date range from the chart diagram by mouse, when I select the last one at the edge or the first one, a start filter is added with the time range and the data is not shown.
The problem is on the both edges in the chart diagram.
Test Steps
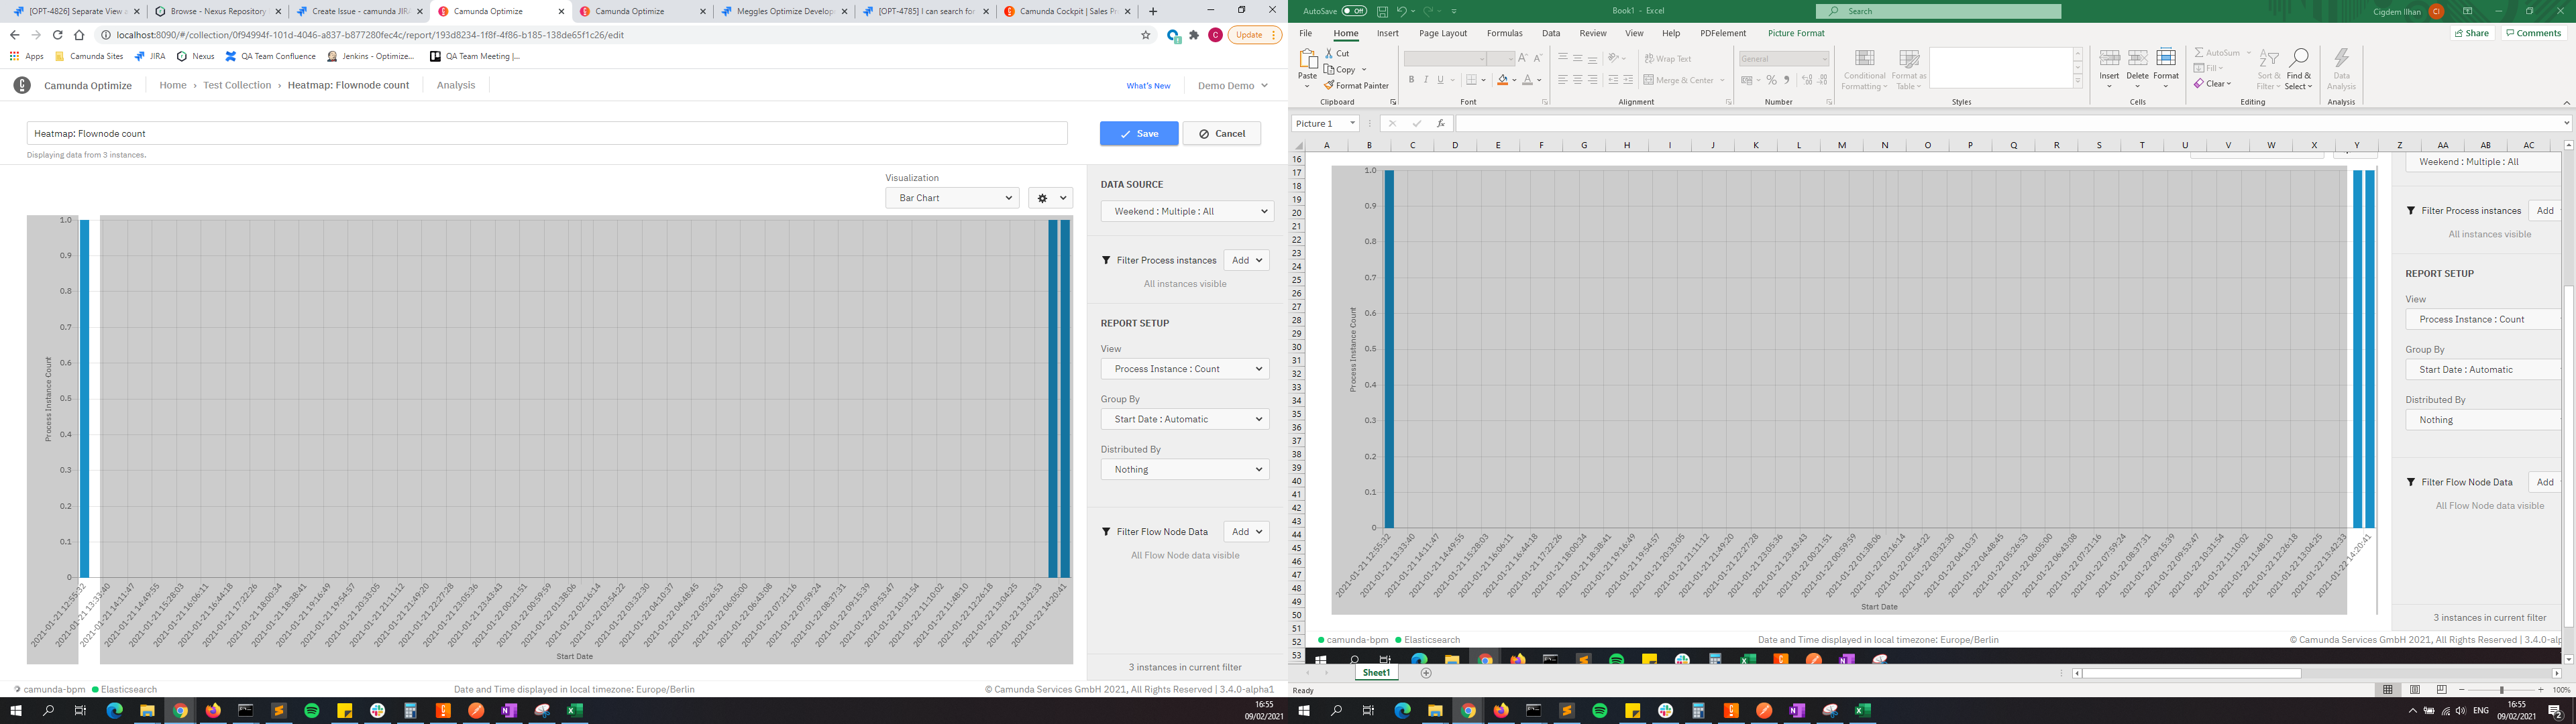
1. Create a 'Process Instance Count' report, grouped by Start Date and visualized as bar/line chart
2. Select a time range from the chart (select the both edges)
3. A start filter is added with the time range and the data is not shown
Desired behavior:
Dragging to the edge of the element includes the maximum value on that side (or doesn't constrain it on that side)