-
Type:
Design Part
-
Resolution: Unresolved
-
Priority:
 L3 - Default
-
None
-
Affects Version/s: None
-
Component/s: None
-
2
-
Not defined
To do:
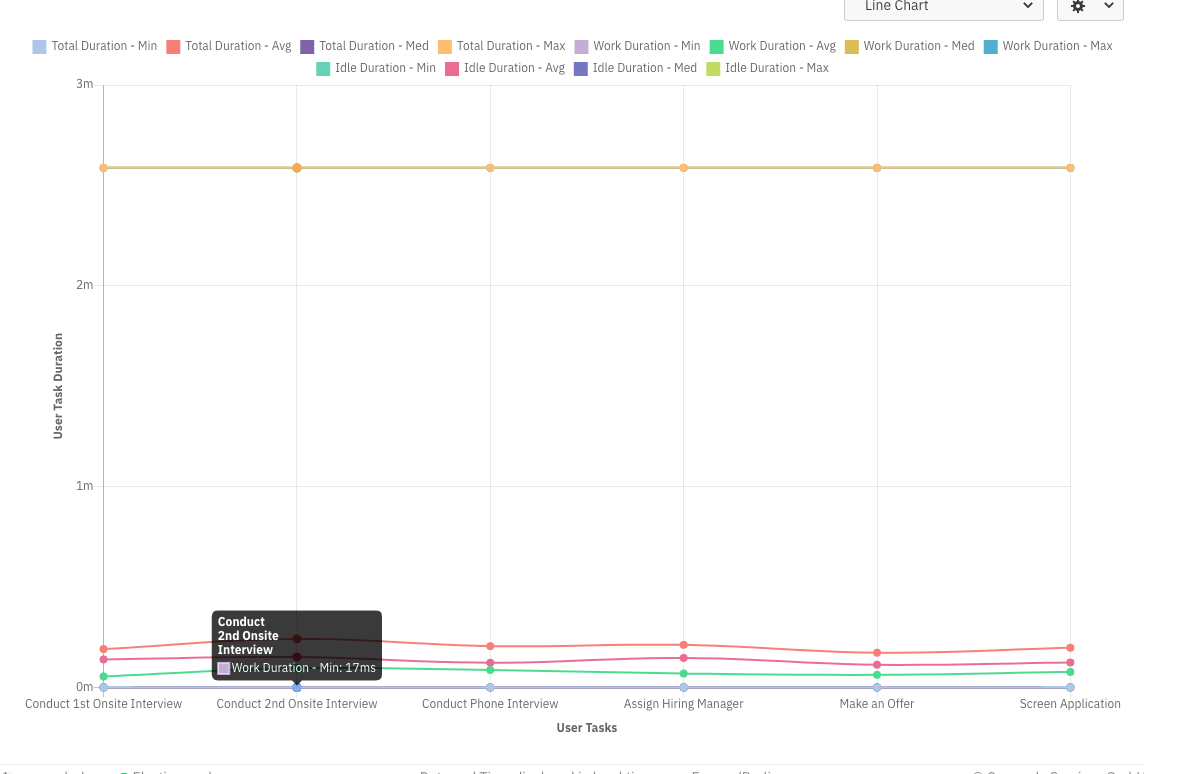
- Improve hover in charts - make it clearer which data points relate to which axis by fading all unrelated info.
- -Make the Legend titles bold -
https://jira.camunda.com/browse/OPT-4530 - High volume Legend display
https://www.chartjs.org/docs/latest/configuration/legend.html
Maybe legend overflow? - Do not 'hide' small values on large axis - requires reaserch.
- How to colour data points of multiple metrics. Ie. in multi metric distributed charts such as user task dist. assignee
Line Charts
- Display multiple data points in tooltip when the data is in the same point. (See screenshot)
Empty states
- Display distributions in all charts, not just pie charts. See image.
*