-
Bug Report
-
Resolution: Fixed
-
 L3 - Default
-
None
-
stage
-
1
-
Not defined
-
3 - Expected
Problem:
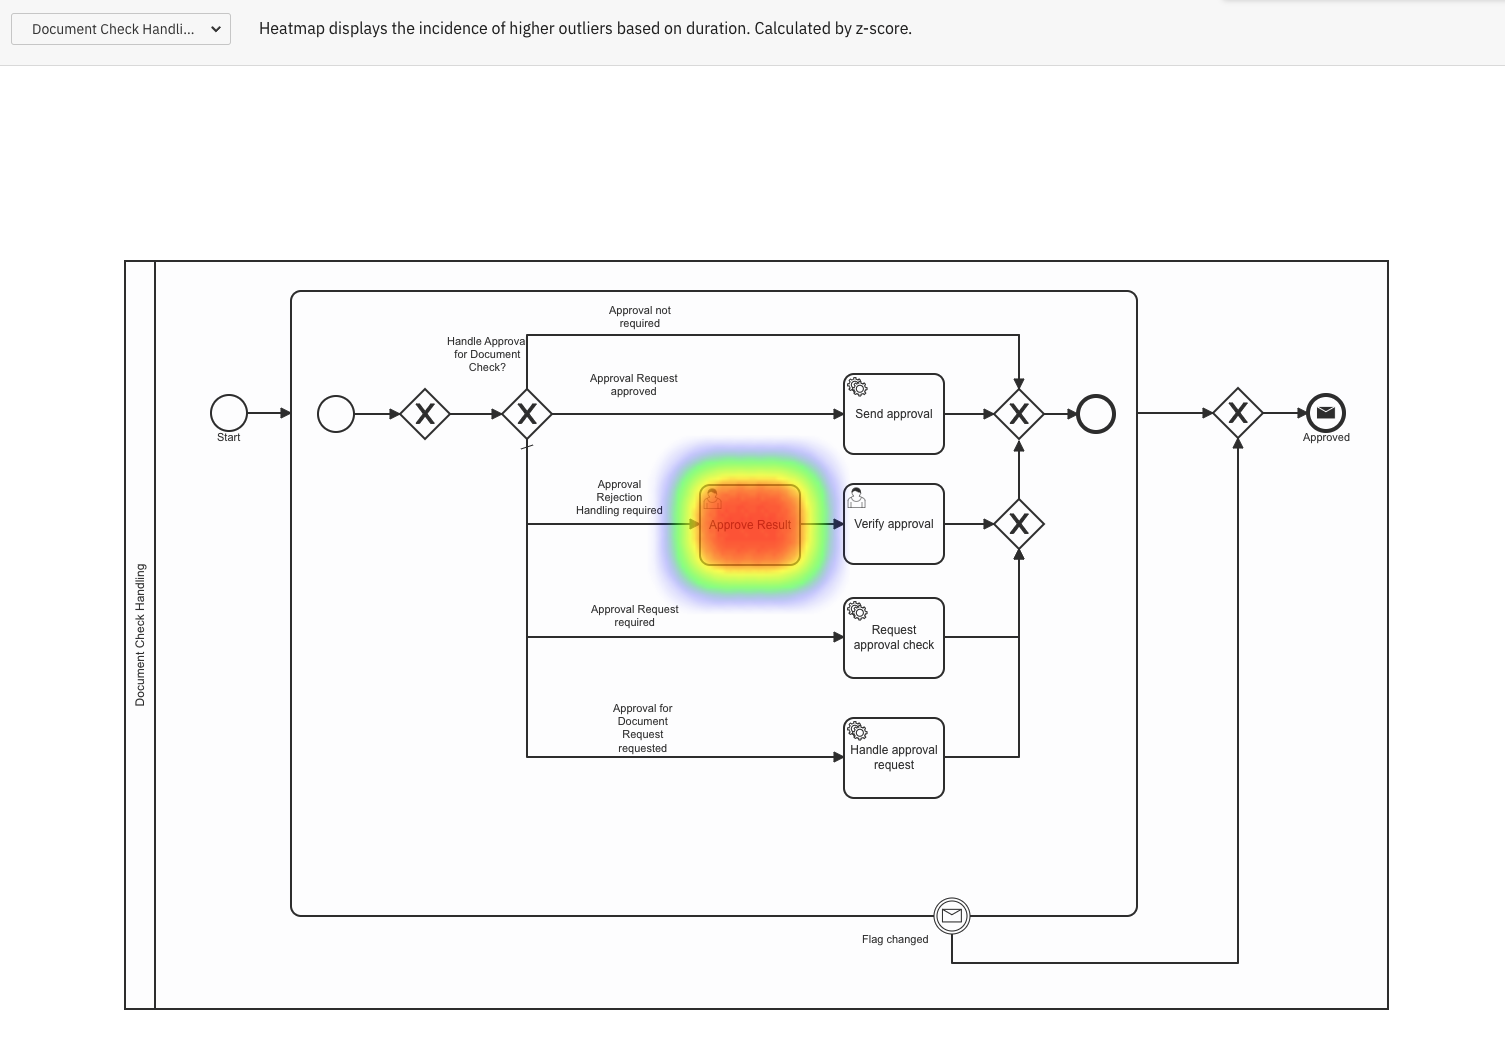
When viewing the outlier heatmap in Optimize's Outlier Analysis page, automatic tasks show extremely red.
Steps to reproduce:
- Load Optimize on Stage (https://stage.optimize.camunda.cloud/#/analysis)
- Load the Book Request One Tenant into the Outlier Analysis page
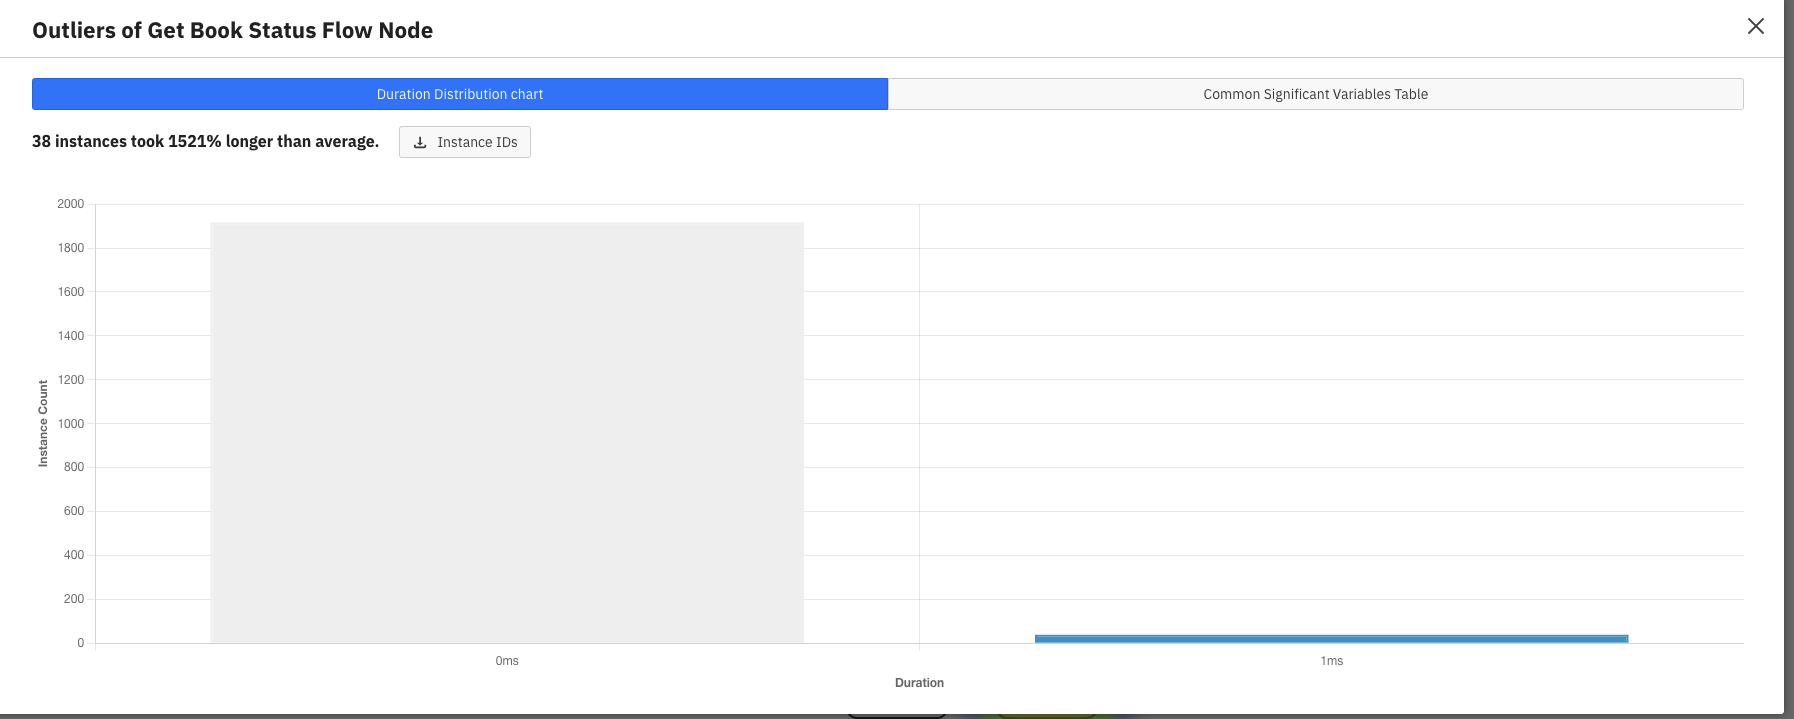
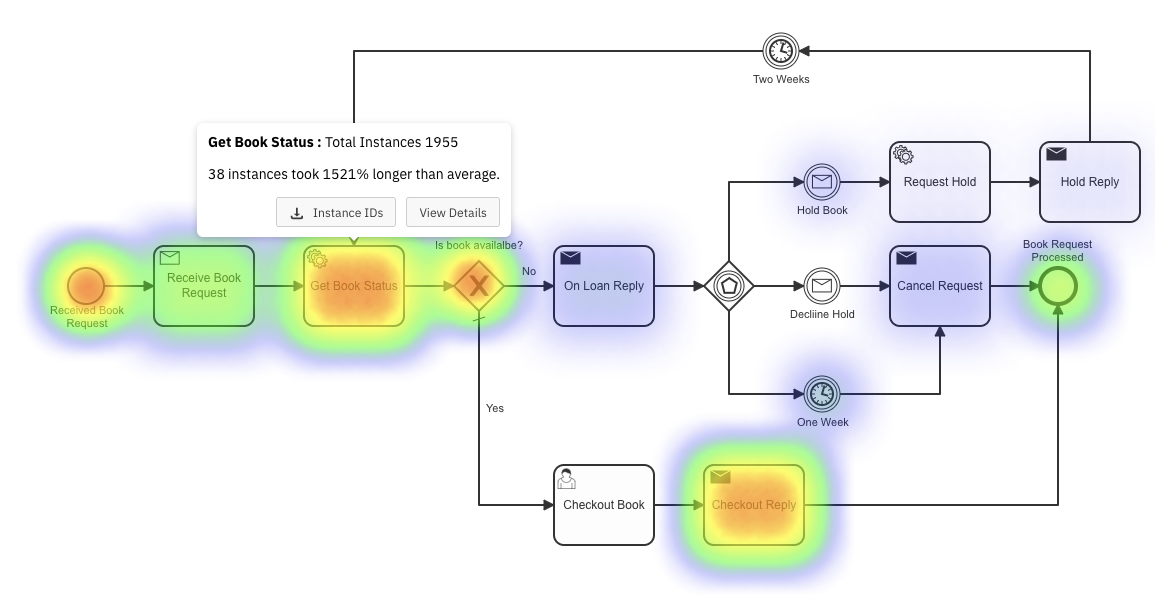
- Inspect an automated task ("Get Book Status")
Actual result :
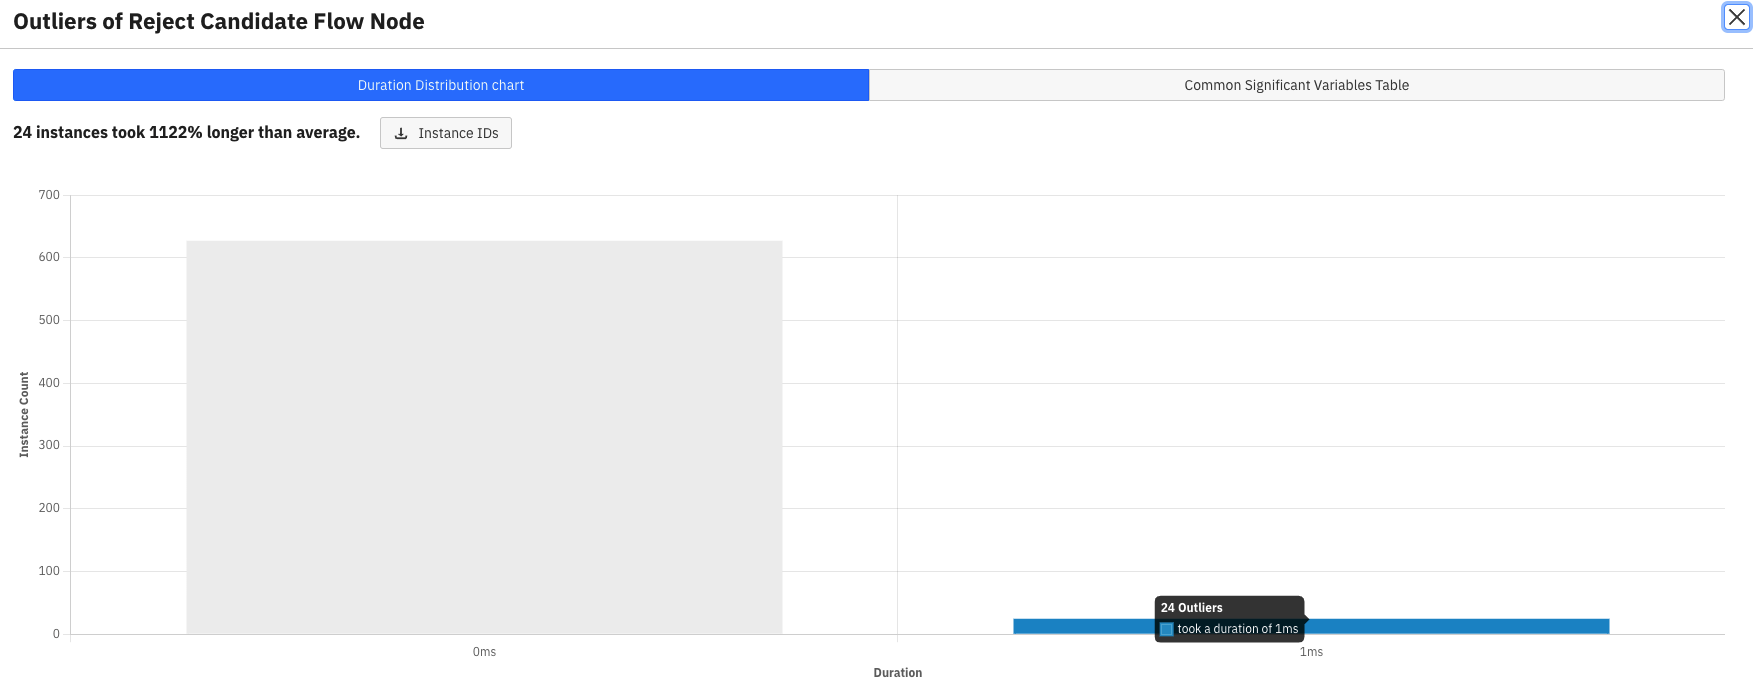
Expected result:
I don't care about any flow nodes that take less than 50ms. I mostly care about user tasks or other longer-running tasks
This is the controller panel for Smart Panels app


[OPT-5505] Outlier detection heatmap falsely emphasizes automatic tasks
| PM Priority | New: 2 |
| Rank | New: Ranked higher |
| Rank | New: Ranked lower |
| PM Priority | Original: 2 | New: 1 |
| Labels | New: potential_for_3.7 |
| Status | Original: Open [ 1 ] | New: Scheduled [ 10912 ] |
| Component/s | New: backend [ 13653 ] |
| Mentioned Roles |
| Mentioned Groups |
| Mentioned Roles |
| Mentioned Groups |