Problem Definition
User Story
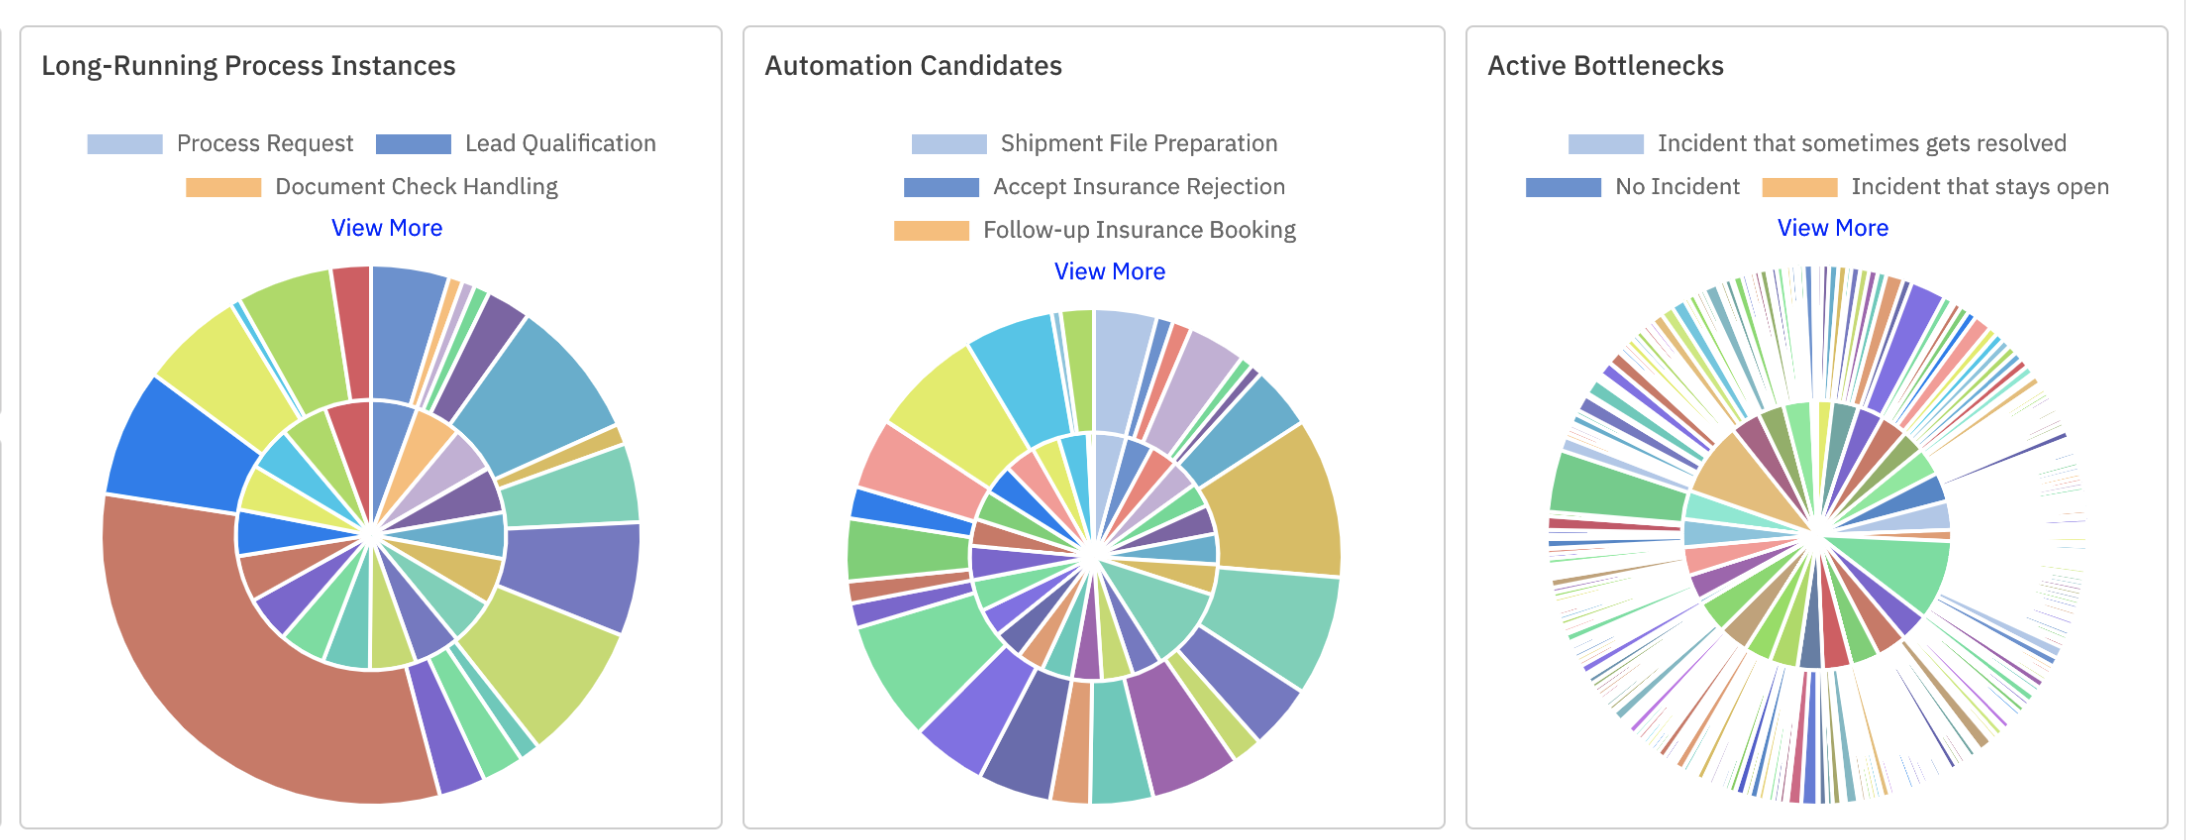
When I display a report with many data values (like a pie chart with 100+ options)
I want to collapse insignificant values
So that I can focus on the important numbers
Use Cases
- Display complex pie chart reports
- Display management dashboards with many processes and flow nodes
PM Notes (Customer requests, context, assumptions)

- We appear to run out of colors on the far right option using the Stage dataset. I expect it to be equally unreadable in other cases
- While ideally N should be configurable, the top 5 is a reasonable default
Solution Definition
Solution Ideas
Design Notes (Videos, mockups, guidance)
User Scenario
GIVEN
(MH/SH/NTH) WHEN
(MH/SH/NTH) THEN