Uploaded image for project: 'Camunda Optimize'
  1. Camunda Optimize
  2. OPT-6457

Target line value is incorrect when changing the scale to be logarithmic

    XMLWordPrintable

Details

    • Bug Report
    • Resolution: Fixed
    • L3 - Default
    • 3.9.0
    • None
    • frontend
    • None
    • Not defined

    Description

      Brief summary of the bug. What is it ? Where is it ?

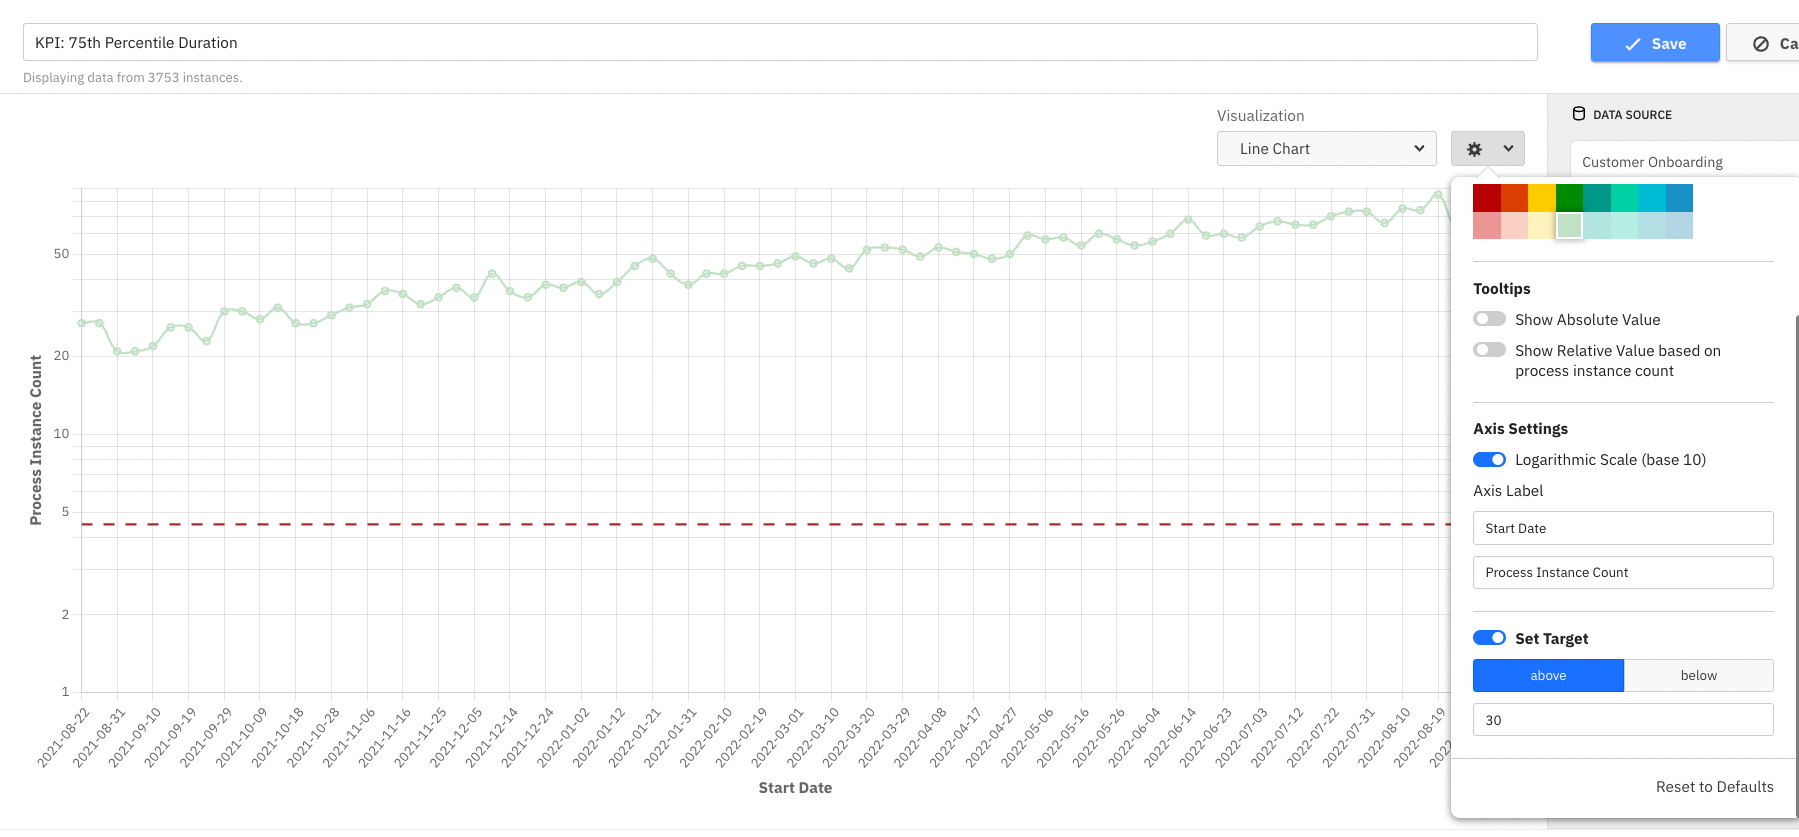
      When setting the target line to a value and enabling the log scale configuration. the placement of the target line is wrong on the chart.

      Steps to reproduce:

      • Create a process instance report
      • select group by start-date - automatic
      • select line chart visualization
      • open the configuration popover
      • enable target line option and set a value
      • enable the logarithmic scale from the config as well

      Actual result:

      The goal line is shown in the chart in the wrong place. see screenshot.

      Expected result:

      The goal line appear on the correct value that is set to.

      Test Notes: 

      • Try to break it by trying unexpected values
      • Try out the target line on different visualizations (line/bar/barline) and report configuration (combined report/multi measure/multi aggregation/multiprocess)

      mgm-controller-panel

        This is the controller panel for Smart Panels app

        Attachments

          Activity

            People

              Unassigned Unassigned
              omran.abazeed Omran Abazeed
              Votes:
              0 Vote for this issue
              Watchers:
              1 Start watching this issue

              Dates

                Created:
                Updated:
                Resolved:

                Salesforce