Uploaded image for project: 'Camunda Optimize'
  1. Camunda Optimize
  2. OPT-6465

"Version Latest" configuration on a report "Flownode duration" or "Flownode count" doesn't work as expected

    • Icon: Bug Report Bug Report
    • Resolution: Unresolved
    • Icon: L3 - Default L3 - Default
    • None
    • None
    • None
    • None
    • Not defined

      What is the problem ?

      Heatmap report does not always automatically respect latest version of updated BPMN model:
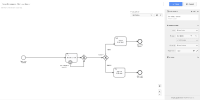
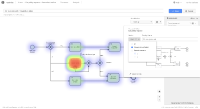
      When deploying an updated version of a definition, the heatmap BPMN for a "version:latest" report is not automatically updated in the report view mode. Instead, it is still showing v1 of the BPMN model instead of the latest v2 of the model. It is being updated correctly in the preview of the definition selection. If you change the version selection to sth else and then back to lastest, the bpmn is also displayed correctly in the report view mode.

      Prerequisites:

      • A test model was deployed

      Steps to reproduce:

      • Create a heatmap report on the deployed test process, configuring "Version latest" for the report definition source
      • Alter the test process model in some way, eg adding a flownode, and deploy it as version 2 of this same process
      • Wait until Optimize has imported the new data
      • Refresh the heatmap report

      Actual result:

      The heatmap in the report still displays the BPMN of version 1 of the process instead of the updated version 2, despite the report being configured to analyse the "latest" version.
      If the user edits the version selection, eg manually selecting a specific version, and then swtiches back to "latest", the heatmap is updated correctly.

      Expected result:

      The heatmap in a "version: latest" report should always automatically update to the latest BPMN of the respective process.
        This is the controller panel for Smart Panels app

          1. attach1.png
            attach1.png
            305 kB
          2. attach2.png
            attach2.png
            989 kB
          3. callMultiplePolicyRequests.bpmn
            3 kB
          4. carPolicyRequest-final.bpmn
            13 kB
          5. carPolicyRequestProcess-init.bpmn
            7 kB
          6. image (1).png
            image (1).png
            1.14 MB
          7. image (2).png
            image (2).png
            827 kB
          8. Screen Recording 2023-01-20 at 11.04.44.mov
            23.70 MB
          9. Screenshot 2022-09-26 at 08.50.43.png
            Screenshot 2022-09-26 at 08.50.43.png
            117 kB

            [OPT-6465] "Version Latest" configuration on a report "Flownode duration" or "Flownode count" doesn't work as expected

            Hi, I'm using Enrico's Curiotto Organization. Don't remember if and when I created it, or it was provided by default.

            Enrico Curiotto added a comment - Hi, I'm using Enrico's Curiotto Organization. Don't remember if and when I created it, or it was provided by default.

            Hi cigdem.ilhan , i am running into the exact same problem like Enrico. I am using Optimize 3.9.3 and the same diagrams that Enrico shared in his screenshots.

            I also attached those diagrams.

            Steps to reproduce:

            1. Deploy carPolicyRequest-init.bpmn and callMultiplePolicyRequest.bpmn
            2. run callMultiplePolicyRequest (no vars required)
            3. Create a heatmap report in Optimize: Flownode Duration and Flownode Count, both using Versin: Latest
            4. Deploy callMultiplePolicyRequest-final.bpmn (not sure if this is relevant, but i stored both diagrams in separate files in Camunda Web Modeler)
            5. run run callMultiplePolicyRequest again. Now you should have the same "broken" heatmap like in Enricos screenshot.

            Currently this issue blocks us from publishing the "Getting Started with Optimize" course in academy. Can you have a look at it again?

            Jana Eschwaltrup added a comment - Hi cigdem.ilhan , i am running into the exact same problem like Enrico. I am using Optimize 3.9.3 and the same diagrams that Enrico shared in his screenshots. I also attached those diagrams. Steps to reproduce: Deploy carPolicyRequest-init.bpmn and callMultiplePolicyRequest.bpmn run callMultiplePolicyRequest (no vars required) Create a heatmap report in Optimize: Flownode Duration and Flownode Count, both using Versin: Latest Deploy callMultiplePolicyRequest-final.bpmn (not sure if this is relevant, but i stored both diagrams in separate files in Camunda Web Modeler) run run callMultiplePolicyRequest again. Now you should have the same "broken" heatmap like in Enricos screenshot. Currently this issue blocks us from publishing the "Getting Started with Optimize" course in academy. Can you have a look at it again?

            Hi jana.eschwaltrup , I tested your issue on my side with diagrams you mentioned, seems works fine on my side. You can find the screenshots attached. Please let me know if I can support you more. 

            Cigdem Ilhan added a comment - Hi jana.eschwaltrup , I tested your issue on my side with diagrams you mentioned, seems works fine on my side. You can find the screenshots attached. Please let me know if I can support you more. 

            Hi cigdem.ilhan

            is there any update on this topic? The bug is still existing in Optimize 3.10.0-alpha4

            Jana Eschwaltrup added a comment - Hi cigdem.ilhan is there any update on this topic? The bug is still existing in Optimize 3.10.0-alpha4

            Hello cigdem.ilhan ,

            the same behaviour appeared for a customer using Optimize 3.9.3 with Camunda 7. This finding was part of our interaction here: https://jira.camunda.com/browse/SUPPORT-16420

            joshua.windels pointed me to this bug report in Slack: https://camunda.slack.com/archives/C55U06YRG/p1683196047007169

            Jonathan

            Jonathan Lukas added a comment - Hello cigdem.ilhan , the same behaviour appeared for a customer using Optimize 3.9.3 with Camunda 7. This finding was part of our interaction here: https://jira.camunda.com/browse/SUPPORT-16420 joshua.windels pointed me to this bug report in Slack: https://camunda.slack.com/archives/C55U06YRG/p1683196047007169 Jonathan

            Hey cigdem.ilhan ,

            Another prospect has raised this bug today as well.

            Do we have any updates on this?

            Thanks!

            Norman Lüring added a comment - Hey cigdem.ilhan , Another prospect has raised this bug today as well. Do we have any updates on this? Thanks!

            Just for the record: We added a workaround for the Camunda Academy course "Getting Started with Optimize" which will be published soon. It should be removed once the bug is fixed. 

            Victor Garcia Pereda added a comment - Just for the record: We added a workaround for the Camunda Academy course "Getting Started with Optimize" which will be published soon. It should be removed once the bug is fixed. 

            Hi helene.waechtler,
            I've re-executed the processes as described.
            I can confirm what you have observed about the diagram that doesn't update, but still shows the colors of the heatmap.
            If I remember correctly, when I tried one year ago, the process picture was not updated and also the heatmap colors were not applied (I used the generic term "broken", I should have better specified).

            If the second version of the process generates incidents, then the report will still show the v1 version, in standard black and white (no heatmap applied).

            Thanks to you for your help!
            If I'm not clear enough I could show you a recording or have a quick zoom call with screen sharing.

            Enrico Curiotto added a comment - Hi helene.waechtler , I've re-executed the processes as described. I can confirm what you have observed about the diagram that doesn't update, but still shows the colors of the heatmap. If I remember correctly, when I tried one year ago, the process picture was not updated and also the heatmap colors were not applied (I used the generic term "broken", I should have better specified). If the second version of the process generates incidents, then the report will still show the v1 version, in standard black and white (no heatmap applied). Thanks to you for your help! If I'm not clear enough I could show you a recording or have a quick zoom call with screen sharing.

            Hi helene.waechtler i referred to Enricos screenshot where the diagram should look like but instead shows the diagram from the previous version without any heat colors on it. You can also see the video of how i reproduced that with Optimize 3.9.3 in Screen Recording 2023-01-20 at 11.04.44.mov

            With the latest version i could not reproduce that anymore.

            Jana Eschwaltrup added a comment - Hi helene.waechtler i referred to Enricos screenshot where the diagram should look like but instead shows the diagram from the previous version without any heat colors on it. You can also see the video of how i reproduced that with Optimize 3.9.3 in Screen Recording 2023-01-20 at 11.04.44.mov With the latest version i could not reproduce that anymore.

            This ticket was migrated to github: https://github.com/camunda/camunda-optimize/issues/10033. Please use this link for any future references and continue any discussion there.

            Omran Abazeed added a comment - This ticket was migrated to github: https://github.com/camunda/camunda-optimize/issues/10033 . Please use this link for any future references and continue any discussion there.

              helene.waechtler Helene Waechtler
              cigdem.ilhan Cigdem Ilhan
              Votes:
              0 Vote for this issue
              Watchers:
              8 Start watching this issue

                Created:
                Updated: