-
Type:
Bug Report
-
Resolution: Fixed
-
Priority:
 L3 - Default
-
Affects Version/s: None
-
Component/s: frontend
-
None
-
Not defined
Brief summary of the bug. What is it ? Where is it ?
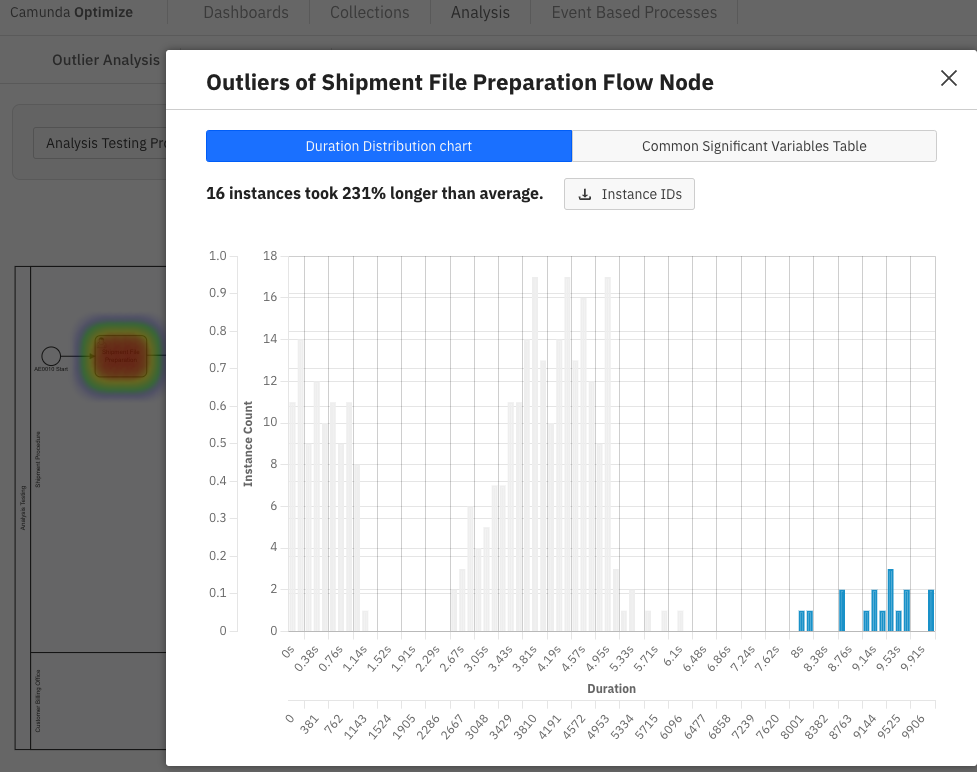
The outliers chart have repeated x-axis and y-axis after upgrade to v4.
Steps to reproduce:
- Go to the outlier analysis page
- Select a definition and hover over a flow node that has a heat on it
- Click on view details from the tooltip
Actual result:
The outliers chart axis is duplicated. See attached screenshot.
Expected result:
The outliers chart has only one x-axis and one y-axis.