-
Type:
Feature Request
-
Resolution: Unresolved
-
Priority:
 L3 - Default
-
None
-
Affects Version/s: None
-
2
-
Not defined
-
3 - Expected
Problem Definition
User Story
When I view duration reports
I want to see outliers
So that I know where to intervene
PM Notes (Customer requests, context, assumptions)
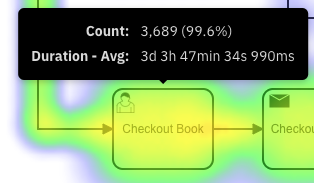
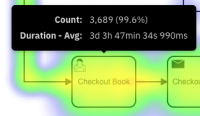
- Dispersion (also called variability, scatter, or spread) is the extent to which a distribution is stretched or squeezed. Within Optimize for duration charts it can make sense to display the number of instances above or below a certain duration to identify how the durations are spread across the instances.
- Looking at duration AND variation at the same time is valuable
- This is likely relevant for time-based goals.
Solution Definition
Solution Ideas
- Consider integrating the outlier analysis component into the heatmap report
- Add "number of outliers" as an aggregation option (potentially only for flownode duration reports)
- We could leverage multi-measure reports with count of outliers

Design Notes (Videos, mockups, guidance)
User Scenario
GIVEN
(MH/SH/NTH) WHEN
(MH/SH/NTH) THEN