-
Feature Request
-
Resolution: Unresolved
-
 L3 - Default
-
None
-
None
-
2
-
M
-
3 - Expected
What is the desired functionality that you are missing?
As a UI user
I want to view the latest timestamp of data for a given process
So I can identify if there's a delay in data import
Which problem are you going to solve with this functionality?
As a User, it is hard to know when the data is up-to-date. It should be always the latest state, but when there is a high load on the engine and Optimize is not able to pull data quickly enough, there might be some small delay.
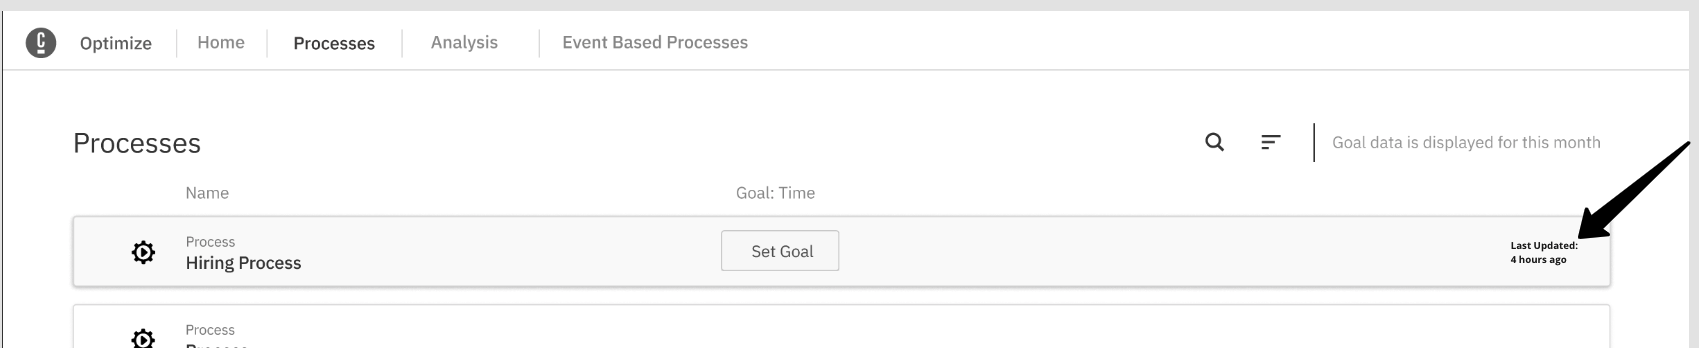
User Scenario
GIVEN I am viewing the Processes page
AND I can see data from a process
THEN I can view the latest activity in that process
(Use curl http://localhost:8098/optimize-timestamp-based-import-index/_doc/_search?pretty)
Hint
- There are many date options:
- Last started (process instance start timestamp)
- Last ended (process instance end timestamp)
- Last activity (last data import)
- Ideally, the time is relative and approximate (e.g. "2 hours ago")
- Updates more frequent than 1 minute is not valuable. Refer to the dashboard refresh rate, where the most frequent option is 1 minute
- It's especially important to display the timestamp when data is being imported from the engine.
- Display the timestamp on hover
- Example tooltip is below
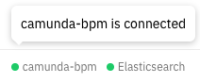

This is the controller panel for Smart Panels app

[OPT-5917] Show last timestamp of data imported from engine
| Link | New: This issue is related to SUPPORT-9575 [ SUPPORT-9575 ] |
| Attachment | New: image-2022-01-21-09-29-45-128.png [ 48886 ] | |
| Description |
Original:
*What is the desired functionality that you are missing?*
As a User, I would like to be able to see the import progress (in percentage) from the different engines that are connected to Optimize in the user interface (e.g. when hovering over the connection status in the footer). In combination with OPT-4774 this will also allow me to monitor if the import works as expected. *Context*: At the moment in the footer it does not make sense to display all timestamps since technically Optimize has multiple different import jobs running in the background (process instances, activities, variables, decision, etc). Displaying all of them in the footer would overwhelm the user. Additionally, there are many scenarios where it actually can make sense that the last import date does not move - e.g. since the engine does not have new data. This would mean the user would even need all timestamps from latest insert in the engine. Therefore the timestamps will rather be used to automatically calculate a meaningful import progress percentage that makes more sense to the user. In case errors occur during the import, OPT-4774 will additionally display warnings. *Which problem are you going to solve with this functionality?* As a User, it is hard to know when the data is up-to-date. It should be always the latest state, but when there is a high load on the engine and Optimize is not able to pull data quickly enough, there might be some small delay. *In UI:* * Percentage as described below *Calculate Progress Percentage based on:* TOI - Timestamp of oldest imported entity (on Optimize Side) TLI - Timestamp of last imported entity (on Optimize side) ELT - Latest timestamp from entity in engine Import Progress = (TLI - TOI) / (ELT - TOI) * 100 --> Note: This is similar to how we do it with the Event Based Process Publishing (maybe even the same). |
New:
h3. What is the desired functionality that you are missing?
As a UI user I want to view the latest timestamp of data imported from a given engine So I can identify if there's a delay in data import h3. Which problem are you going to solve with this functionality? As a User, it is hard to know when the data is up-to-date. It should be always the latest state, but when there is a high load on the engine and Optimize is not able to pull data quickly enough, there might be some small delay. h3. User Scenario GIVEN I am viewing the Optimize UI AND at least one engine is connected AND I can view the engine THEN I can view the latest timestamp of any data imported from a given engine AND the latest timestamp updates periodically (Use curl http://localhost:8098/optimize-timestamp-based-import-index/_doc/_search?pretty) h3. Hint - Display the timestamp on hover - Ideally, the time is relative and approximate (e.g. "2 hours ago") - Updates more frequent than 1 minute is not valuable, similar to the dashboard refresh rate !image-2022-01-21-09-29-45-128.png|thumbnail! |
| Effort | Original: L [ 11256 ] | |
| Reporter | Original: Felix Mueller [ felix.mueller ] | New: Eric Lundberg [ eric.lundberg ] |
| Target Quality | New: 3 - Expected [ 11752 ] |
| Mentioned Roles |
| Mentioned Groups |
| Description |
Original:
h3. What is the desired functionality that you are missing?
As a UI user I want to view the latest timestamp of data imported from a given engine So I can identify if there's a delay in data import h3. Which problem are you going to solve with this functionality? As a User, it is hard to know when the data is up-to-date. It should be always the latest state, but when there is a high load on the engine and Optimize is not able to pull data quickly enough, there might be some small delay. h3. User Scenario GIVEN I am viewing the Optimize UI AND at least one engine is connected AND I can view the engine THEN I can view the latest timestamp of any data imported from a given engine AND the latest timestamp updates periodically (Use curl http://localhost:8098/optimize-timestamp-based-import-index/_doc/_search?pretty) h3. Hint - Display the timestamp on hover - Ideally, the time is relative and approximate (e.g. "2 hours ago") - Updates more frequent than 1 minute is not valuable, similar to the dashboard refresh rate !image-2022-01-21-09-29-45-128.png|thumbnail! |
New:
h3. What is the desired functionality that you are missing?
As a UI user I want to view the latest timestamp of data imported from a given engine So I can identify if there's a delay in data import h3. Which problem are you going to solve with this functionality? As a User, it is hard to know when the data is up-to-date. It should be always the latest state, but when there is a high load on the engine and Optimize is not able to pull data quickly enough, there might be some small delay. h3. User Scenario GIVEN I am viewing the Optimize UI AND at least one engine is connected AND I can view the engine THEN I can view the latest timestamp of any data imported from a given engine AND the latest timestamp updates periodically (Use curl http://localhost:8098/optimize-timestamp-based-import-index/_doc/_search?pretty) h3. Hint - Ideally, the time is relative and approximate (e.g. "2 hours ago") - Updates more frequent than 1 minute is not valuable. Refer to the dashboard refresh rate, where the most frequent option is 1 minute - Display the timestamp on hover - Example tooltip is below !image-2022-01-21-09-29-45-128.png|thumbnail! |
| Mentioned Roles |
| Mentioned Groups |
| PM Priority | Original: 3 | New: 2 |
| Rank | New: Ranked higher |