Uploaded image for project: 'camunda BPM'
  1. camunda BPM
  2. CAM-11770

In Cockpit, error details are not shown correctly

    XMLWordPrintable

Details

    Description

      Steps to reproduce:

      1. Deploy a process containing an external task with topic name "foo"
      2. Start an instance of that process
      3. Fetch and lock the external task
        POST /external-task/fetchAndLock
        
        {
          "workerId": "abc",
          "maxTasks": 2,
          "topics": [
            {
              "topicName": "foo",
              "lockDuration": 100000
            }
          ]
        }
        
      4. Submit a failure
        POST /external-task/<external-task-id>/failure
        
        {
          "workerId": "abc",
          "errorMessage": "Does not compute",
          "errorDetails": "{\"foo\":\"bar\"}",
          "retries": 0,
          "retryTimeout": 60000
        }
        

      Expected behavior:

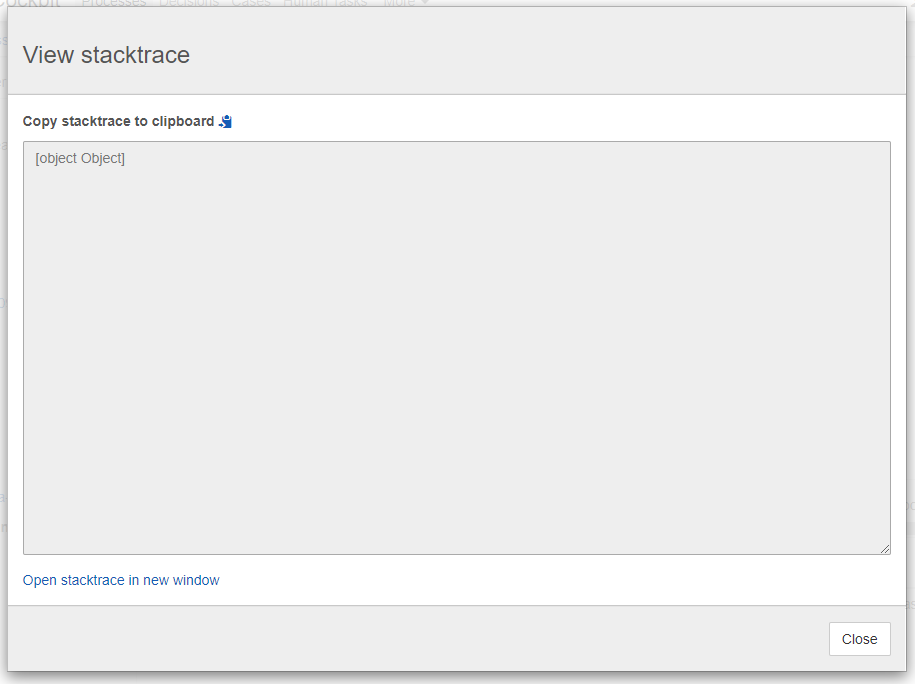
      • When opening the incident error details in Cockpit, the error details are shown accordingly.

      Observed behavior:

      • The error details shows [object Object]:
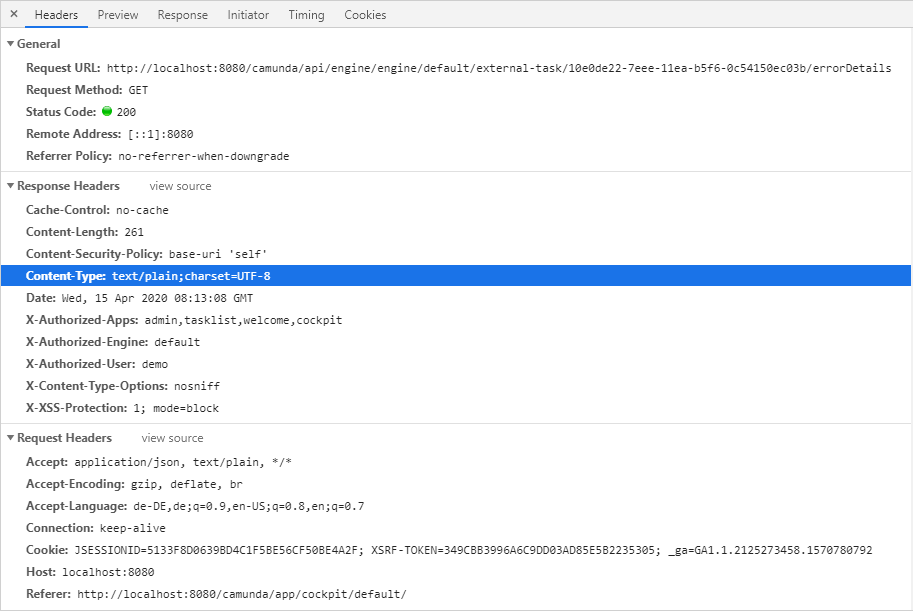
      Hints:

      • The REST API returns the error details as text/plain
      • But AngularJS does a default transformation to JSON: https://docs.angularjs.org/api/ng/service/$http

        If the Content-Type is application/json or the response looks like JSON, deserialize it using a JSON parser.

      mgm-controller-panel

        This is the controller panel for Smart Panels app

        Attachments

          Activity

            People

              michael.schoettes Michael Schoettes
              roman.smirnov Roman Smirnov
              Votes:
              0 Vote for this issue
              Watchers:
              0 Start watching this issue

              Dates

                Created:
                Updated:
                Resolved:

                Salesforce