UI Prototype for simple process instance duration report

XMLWordPrintable

    • Type: Task
    • Resolution: Fixed
    • Priority: L3 - Default
    • 7.5.0, 7.5.0-alpha1
    • Affects Version/s: None
    • Component/s: cockpit
    • None

      AT:

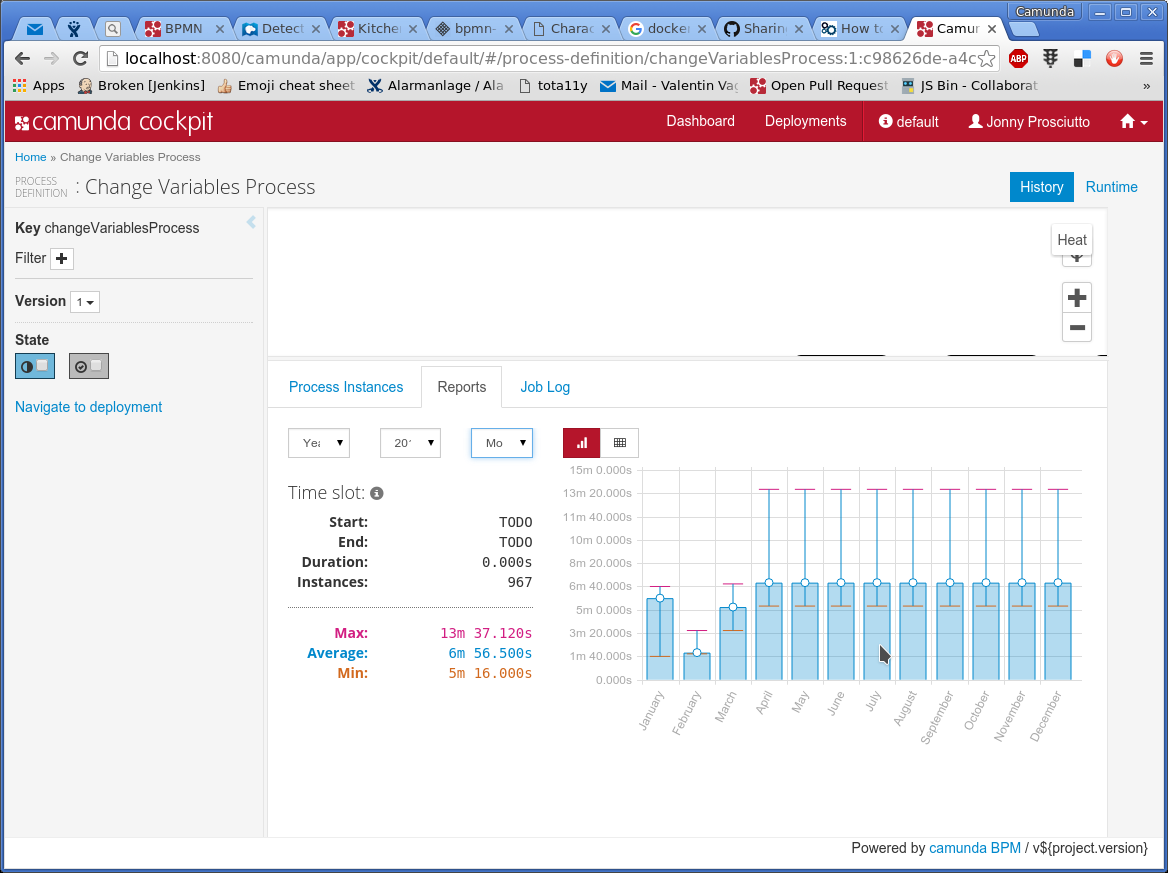
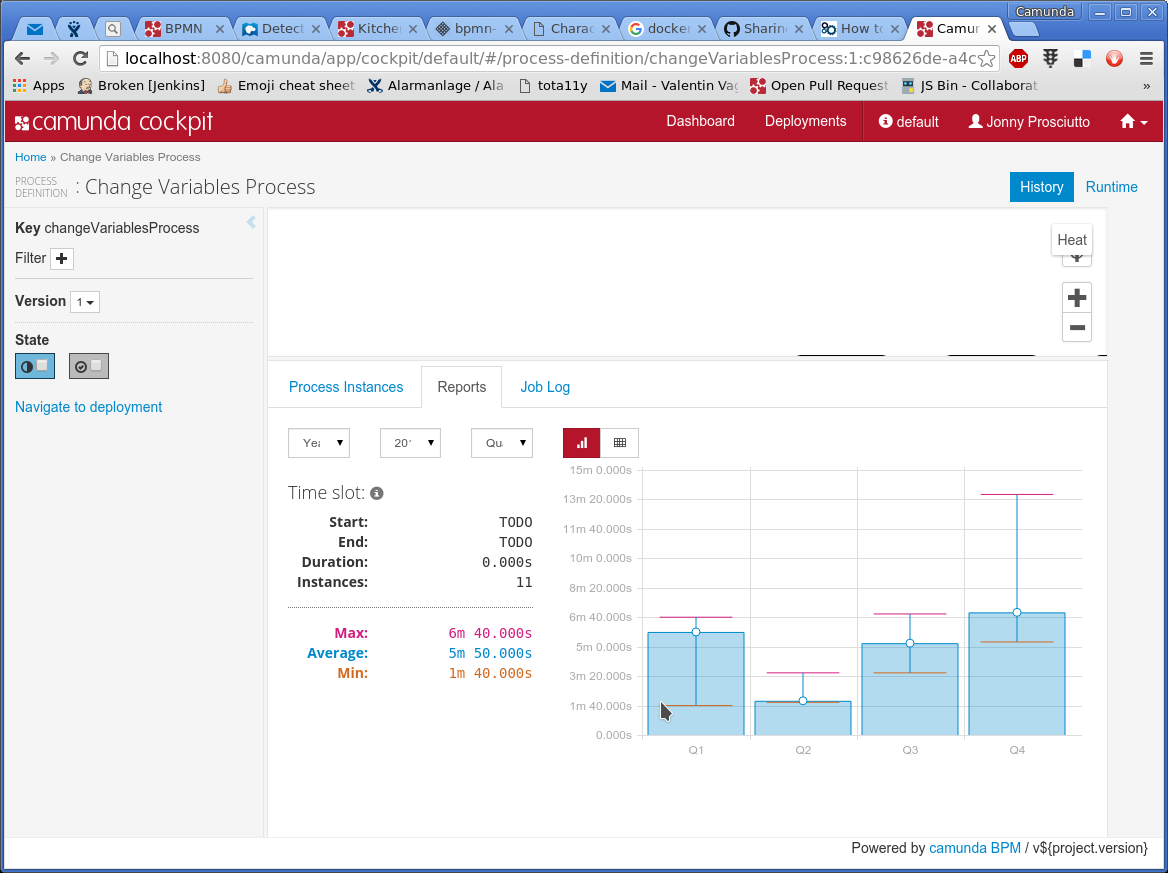
      • I can select a Year (2014, 2015 ...)
      • I can select a "Group By": "Quarter", "Month"
        => I see a Bar Chart which shows for each group interval the MIN, MAX and AVG of the duration of instances which are ended and were started during that interval.

        This is the controller panel for Smart Panels app

          1. reports-2.png
            reports-2.png
            150 kB
          2. reports-1.png
            reports-1.png
            140 kB

              Assignee:
              Valentin
              Reporter:
              Valentin
              Votes:
              0 Vote for this issue
              Watchers:
              2 Start watching this issue

                Created:
                Updated:
                Resolved: