Uploaded image for project: 'camunda BPM'
  1. camunda BPM
  2. CAM-5100

UI Prototype for simple process instance duration report

    XMLWordPrintable

Details

    • Task
    • Resolution: Fixed
    • L3 - Default
    • 7.5.0, 7.5.0-alpha1
    • None
    • cockpit
    • None

    Description

      AT:

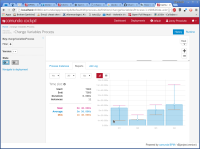
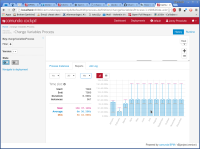
      • I can select a Year (2014, 2015 ...)
      • I can select a "Group By": "Quarter", "Month"
        => I see a Bar Chart which shows for each group interval the MIN, MAX and AVG of the duration of instances which are ended and were started during that interval.
      mgm-controller-panel

        This is the controller panel for Smart Panels app

        Attachments

          1. reports-1.png
            reports-1.png
            140 kB
          2. reports-2.png
            reports-2.png
            150 kB

          Issue Links

            Activity

              People

                valentin.vago Valentin
                valentin.vago Valentin
                Votes:
                0 Vote for this issue
                Watchers:
                2 Start watching this issue

                Dates

                  Created:
                  Updated:
                  Resolved:

                  Salesforce