-
Type:
Feature Request
-
Resolution: Done
-
Priority:
L3 - Default
-
Affects Version/s: None
-
2
-
3 - Expected
Problem Definition
User Story
As a process owner
I want to see the value of a certain percentile of my data
So that I can understand my process's variabiilty
PM Notes (Customer requests, context, assumptions)
- This is the opposite of the percentage of instances that meet certain criteria ("What percentage of PIs take more than 5 days?" vs "How long do 95% of process instances take to complete?")
- Use Case: Track the P99/P95/P90/P75 duration over time
- Use Case: Track variation in a process over time by simulating a box and whisker plot (SUPPORT-7759
Solution Definition
Solution Ideas
- Add a box-and-whisker plot as a visualization option - NOTE: this does not support alerting based on percentile.
- Consider a defined percentile and consolidate minimum (0th percentile), median (50th), and max (100th) into it. We can achieve the same goal as the box-and-whisker plot
Solution Concept:
Design
• It is possible to select percentile aggregations in the following views:
Process instance
Incident
Flow Node
User Task
Variable
• Aggregation options are split into two groups (three in cases of user tasks) with the median option represented as P50 '(median)' and not in the basic aggregation option set.
• When switching to a configuration to something that does not support percentile aggregations, ie. Group by process, only the basic aggregations are visible.
Note: Median aggregation is in the percentile list, and therefore not shown at all.
When displaying a long list of options, ie. for User Tasks, display full list by default and a scroll when necessary.
Design Notes (Videos, mockups, guidance)
[Aggregation menu |zpl.io/40kL0Ky]
User Scenario
DISPLAYING PERCENTILES
GIVEN I have selected a duration measure
(MH) THEN I am able to display duration percentile options
(MH) AND these are displayed in the number report, chart or heatmap
GIVEN I have created a number report, chart or heatmap
(MH) THEN the number report subtitle reads 'Process Instance Duration - PX or PX (median)'
(MH) THEN the chart legends read 'Duration - PX or PX (median)'
(MH) THEN the heatmap select & Tooltips read 'Heat: Duration - P50 (Median, Idle)'
SELECTING AGGREGATIONS
GIVEN That I have configured a duration view
(MH) AND I open the aggregation pop over menu
(MH) THEN I see additional aggregation options for percentiles (see design)
(MH) AND I see the options arranged high to low
(MH) AND I see the median is only represented in the percentile group
CONFIGURATIONS WITH SIMPLE AGGREGATIONS ONLY
GIVEN That I am viewing any aggregation pop over
(MH) THEN I see the options arranged high to low
(MH) AND I see no option for median
DEFAULT SELECTIONS
GIVEN I am viewing the aggregations list
(MH) THEN the default selection is Avg as is the current behaviour
MULTI MEASURE REPORTS
GIVEN I have added a count measure
(MH) THEN I can see both counts and aggregated durations
MULTI PROCESS REPORT
GIVEN I have set percentile aggregations in a duration report
AND I add an additional process
(HM) THEN the aggregation defaults to the standard list of basic aggregations
DISPLAY REPORT IN GOALS
GIVEN That I am setting time goals
(MH) THEN I can see a percentile report grouped by end date
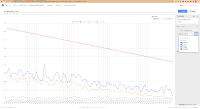
(MH) AND I can see a line chart with P99, P95, P90, P50 and P25
(NTH) WHEN I have the two goal values selected, only those values appear in the line chart
Metrics (if applicable)
- Number of times each different aggregation method is used
This is the controller panel for Smart Panels app
- is depended on by
-
OPT-5943 Time-Based Goal Setting
-
- Done
-
- links to
