Problem Definition
User Story
When analyzing my process's health
I want to see the percentage of process instances that meet filter criteria
So I can evaluate whether the process is running as expected
PM Notes (Customer requests, context, assumptions)
- Raw count is not as actionable as a percentage of the total. For example, I can't tell for certain if 100 incidents on one process are worse than 10 incidents on another, but I know that a 50% incident rate is worse than a 10% incident rate
- Customers use date filters to only show relevant data. They should apply to BOTH numerator AND denominator (e.g. 500 of 2000 instances in the last month, with 10000 processes overall. This should show 500/2000, or 25%)
- Variable filters could theoretically apply to both numerator and denominator OR just the numerator, depending on the variable. This seems like an edge case
- Design: How do we show that filters apply to both numerator and demoninator? Do we use "exclude", "baseline", or another term?
- Assumption: We display % rather than "percent", as it requires less space or translation
- Assumption: It's not a meaningful scope reduction to exclude multi-count aggregation
Use Cases
- (MH) Receiving alerts if the workflow failure rate is too high (i.e. too many PIs reach an unhappy end event)
- (MH) Evaluating whether a time-based goal is met (see the percentage of PIs > 7 days)
- (SH) Devops proving to stakeholders that the incident rate is decreasing, even if the raw number of incidents is increasing
- (SH) Tracking changes over time for a given KPI
- (NTH) Tracking changes over a date variable for a given KPI
- (NTH) Tracking incident rate for multiple processes
Solution Definition
Solution Ideas
• New measure option
• Date filter behaviour update
• Alert creation on % value
Design Notes (Videos, mockups, guidance)
screens https://zpl.io/vMgPYvr
User Scenario
DISPLAYING MEASURES
GIVEN I am viewing a process instance report with a "count" measure
(MH) THEN I am able to change this option to a '% of total instances' measure or...
(NTH) I am able to add an additional '% of total instances' measure to display both.
- Requires additional Alerting work
(SH) BUT if I am viewing a different report (incident, flow node, user task, or variable)
(SH) THEN the percent aggregation is not available
WHEN I select the '% of total instances' measure
(MH) THEN the percentage of the baseline number of process instances that meet the filter criteria is displayed (by default, the baseline is the total number of PIs)
WHEN I select only a count measure
(MH) THEN Optimize behaves as default
WHEN I select the '% of total instances' measure in a grouped configuration
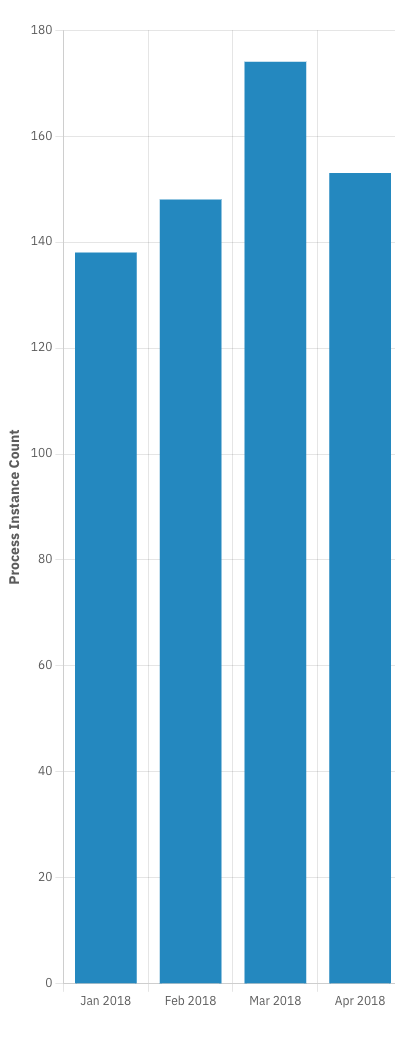
(MH) THEN the percentage of the baseline number of process instances that meet the filter criteria, per bucket, is displayed (by default, the baseline is the total number of PIs)
(MH) AND axes are shown in percent for bar, line, or bar/line charts
(MH) AND a column displays in table views
WHEN I apply a date filter
(MH) THEN I see text in the filter '*Filter applies to the total instance count'
(MH) THEN I see an asterisk before the total instance value wherever it appears
WHEN I am viewing a report with a measure of '% of Total Instances'
(NTH)THEN I only see that value in the tooltip (No Count, No relative value)
(NTH) AND the only tooltip option is '% of Total Instances'
WHEN I apply the logarithmic scale
(NTH) Then this applies to the % axis
- If this is not possible, discuss how to make this clear in the UI
ALERT
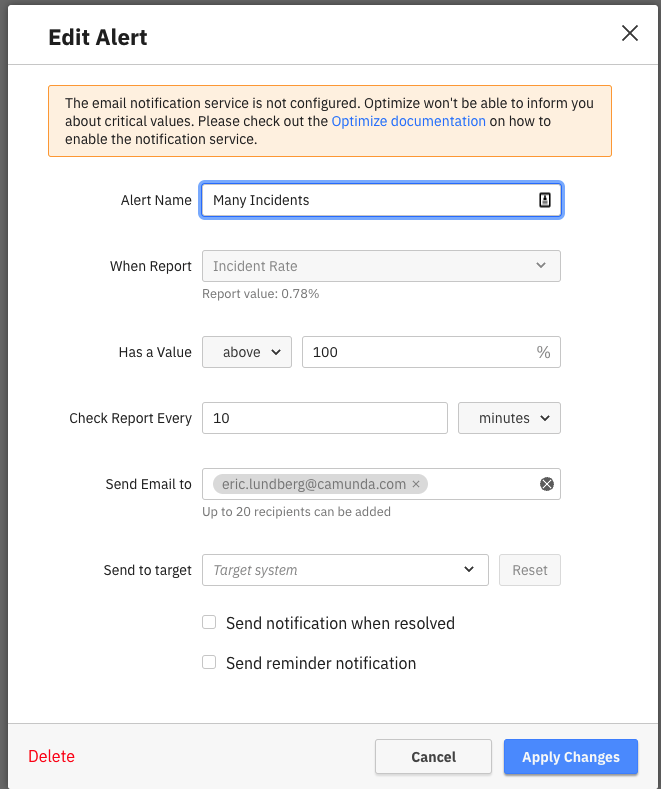
GIVEN I am viewing a process instance count number report with a single measure
(MH) THEN I am able to create an alert for that measure (Percentage of total or count)
GIVEN I have set an alert on either measure
(NTH) THEN I am able to change that measure by editing the report configuration
(NTH) AND the alert updates to reflect the new measure
FILTERING
WHEN I set a filter
(SH) THEN it is automatically applied to the baseline based on type:
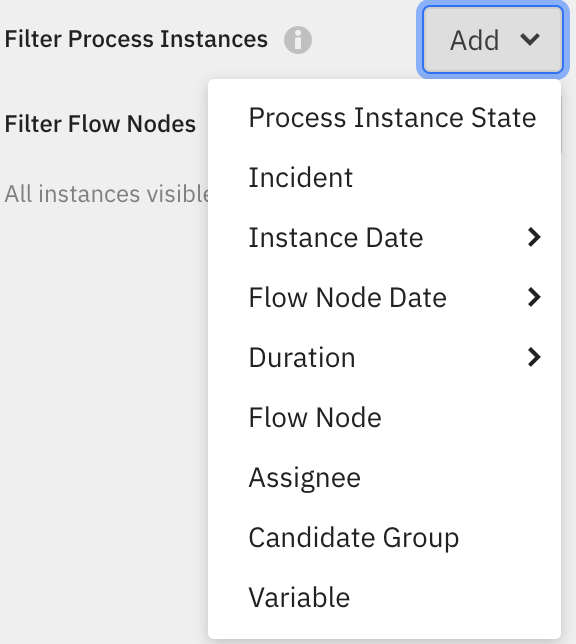
- Instance Date and Flow Node Date are applied to the baseline
- Process Instance State, Incident, Duration, Assignee, Candidate Group, or Variable are not applied to the baseline
WHEN I apply this filter to the baseline
(MH) THEN baseline value is updated in
• instance count display (configured in the config pop over)
• configuration pannel footer
• Instance count string below title (Edit and view)
• In all visualisation calculations
WHEN I save the report
AND I view the applied filters
(MS) THEN I see that the date filter affected the baseline in the filter display

Metrics (if applicable)
- Number of reports per customer with a "percent" count
1.
|
Allow process reports to be viewed as %, grouped by none, distributed by process |
|
Open | Unassigned |
2.
|
Allow process reports to be viewed as %, grouped by duration, distributed by None |
|
Open | Unassigned |
3.
|
Allow process reports to be viewed as %, grouped by End Date, distributed by None |
|
Open | Unassigned |
4.
|
Allow process reports to be viewed as %, grouped by start date, distributed by None |
|
Open | Unassigned |
5.
|
Allow process reports to be viewed as %, grouped by running date, distributed by None |
|
Open | Unassigned |
6.
|
Allow process reports to be viewed as %, grouped by variable, distributed by None |
|
Open | Unassigned |
7.
|
Report viewed as % behaviour is documented |
|
Open | Unassigned |